Creating Data
Two weeks off; two different parts to the workset.
The challenge in this workset is to think a little harder about the process of getting things fixed into data in the world. We talked through digitization about what books become searchable; but the world of structured data is considerably different than that of books.
So we’ll be thinking about how to find some data in the world on two fronts; finding existing data sets from the world of the social sciences, and contributing to new ones through crowdsourcing.
Part I: Analyzing existing data
Find a set of data online related to some research interest (not necessarily your primary research interest). Use the handout from class (also available online) for some pointers; but this will take some time, probably. You might find, particularly if you use SSRC, that the data is stored in some obscure format rather than CSV. (Most likely
stata,sas, orspss.) If that happens, you may be tempted to give up and find a CSV. Don’t be! Just bring it to office hours and we can convert it.Export the data to your disk. Sometimes you can simply download it; other times, you’ll need to create an extract or an account (as in IPUMS). Load it into a spreadsheet program. Note that this will require you to export it in some standard format. That spreadsheet program can be something on your computer like Excel, Numbers, or LibreOffice; or it can be Google Sheets or some online program.
Sort it by some numeric field and try to identify the outliers or, better, errors.
Google spreadsheets has recently added in a number of automatic charts. Load as much of the data as you can into a single spreadsheet and look at the automatically generated results. Share the spreadsheet with no more than 20 words and a url describing what the data is. Your source of data need not be different from everyone else in the class, but your bit here should be.
Based on 3 and 4, whichever is more interesting: screenshot that and send it with a paragraph-long gloss on what it shows to me.
For example (by which I mean, don’t analyze this exact chart but one that you make): I made this chart from some subset of the Atlantic Slave Trade database.
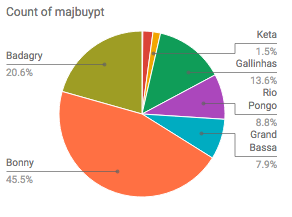 . What does “majbuypt” mean? Why is ‘Bonny’ the most frequent entry? What do you learn about the slave trade and/or the particular data included here based on the example? What kind of paper could you use this data in?
Part II: Contributing to new sets of data
I’ve put a list of historical crowdsourcing projects online. Sign up for one on the Google Sheets, or find something else that you are interested in. Note that some of these require you to actually have something to contribute: if you don’t have a story about the Boston Marathon Bombing, you won’t be able to sign up. On the other hand, others just need your help in transcribing.
Write a post on your blog describing your experience. How did they make the task engaging (if they did)? Would you contribute more? Is the data that the project is gathering worthwhile? Are there good integrity checks? Etc.