Chapter 13 Clustering
The basic form of clustering is to put data into groups.
We’re going to talk about using a very large number of dimensions–the words in a document. But you can do it on a comparatively smaller number of features, as well. The simplest case is clustering on just two dimensions. Let’s go back to our list of cities as an example to see latitude and longitude-based clustering of cities.
How would you group these points together?
13.1 K-means clustering
The simplest method is to choose a fixed number of clusters. An especially widely used form of find the best group of 5 (or 10, or whatever) is k-means clustering. K means is an algorithm that starts by defining a random number of centers, and then assigns each point in your dataset to the closest center’s cluster. It then readjusts each center by making it be the average of all the points in its cluster; and then it checks to see which centers are closest. A nice example video is online here.
The important thing to know about this algorithm is that it can give a different results based on the cluster centers you start with! So a good use of k-means will use a lot of different starting configurations, as defined by the nstart parameter in the code below.
Let’s go back to our data to see how k-means handles the cities. If we ask it for six clusters, we get centers in California, New Mexico, Oklahoma, Indiana, and North Carolina. These are relatively coherent, but the South is sort of divided up; it might be worth trying it with a different number of clusters instead.
library(broom)

cities %>% select(LAT, LON) %>%
  kmeans(centers = 6, iter.max = 1000, nstart = 50) ->
  city_clusters

city_clusters %>% broom::augment(cities) %>%
  inner_join(tidy(city_clusters), by = c(".cluster"="cluster")) ->
  cities_with_clusters

ggplot(cities_with_clusters) +
  aes(x = LON, y = LAT, color = .cluster) +
  geom_point(size = 1) +
  borders(database = "state") +
  coord_quickmap() +
  geom_point(aes(y=x1, x = x2), size = 10, pch=18, alpha = 0.2) +
  geom_segment(aes(xend = x2, yend = x1)) + xlim(-130, -60) +
  labs(title="Kmeans cluster centers")
## Warning: Removed 1 rows containing missing values (geom_point).
## Warning: Removed 1 rows containing missing values (geom_point).## Warning: Removed 1 rows containing missing values (geom_segment).
Changing the value of centers gives very different clusterings. There is never a single correct one: you can just choose between a wide variety of them.
13.2 Hierarchical Clustering
Another method is to build a clustering that works up from the smallest clusters to the largest clusters at once. This tactic is called ‘hierarchical clustering’, and is best visualized using something called a ‘dendrogram’ (or tree-chart; ‘dendro’ is Greek for ‘tree’.)
Hierarchical clustering is a family methods. They find the two closest points, join them together, pretending they’re a single point14 It then finds the next two closest points, and joins them together; and keeps on going until there’s a single group, encompassing everything.
To train a hierarchical cluster is a two step process. First we create a hierarchical clustering model using the hclust
function. Then, to visualize the model, we use the ggdendro package, and two functions inside of it: dendro_data and **segment**.
# Maybe necessary to run:
# install.packages("ggdendro")

library(ggdendro)

dendrogram = cities %>%
  column_to_rownames("CityST") %>%
  select(LON, LAT) %>%
  dist %>%
  hclust(method = "centroid") %>%
  dendro_data

dendrogram %>%
  segment %>%
  ggplot() +
  geom_segment(aes(xend = xend, yend = yend)) +
  aes(x = x, y = y) +
  coord_flip() +
  scale_y_reverse(expand = c(0.3, 0)) +
  geom_text(data = dendrogram$labels, aes(label = label), adj=0)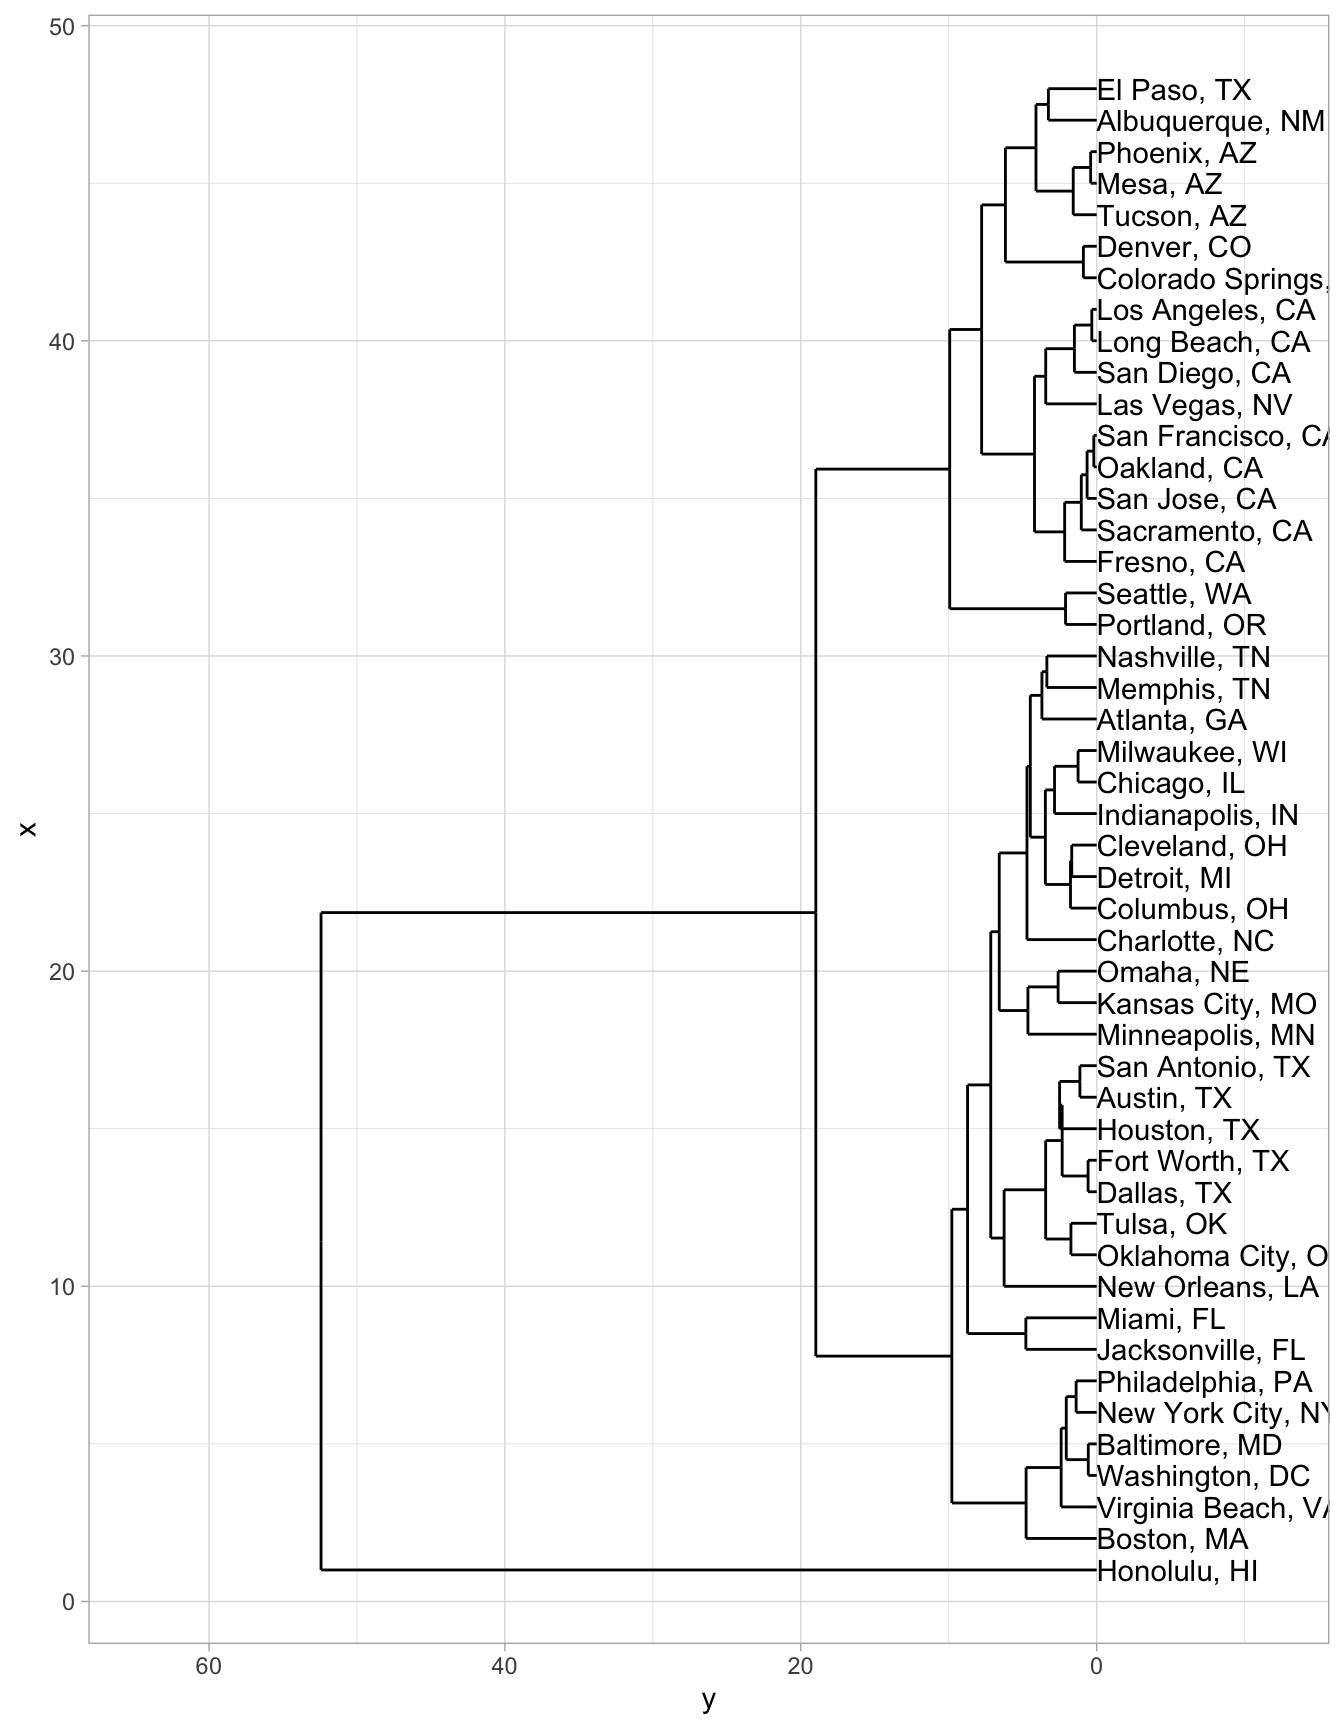
But you could also do a three-dimensional clustering, that relates both location and population change.
The scales will be very different on these, so you can use the R function scale to make them all occupy roughly the same range. (Try fiddling around with some numbers to see what it does, or just put in ?scale.)
That starts to cluster cities together based on things like both location and demographic characteristics. Now the growing cities of San Francisco and San Jose, for instance, are closer to each other than to Oakland: and New Orleans ends up connected to the Rust Belt cities of Detroit and Cleveland because it, too, experienced large population decreases.
cities %>%
  mutate(LON = scale(LON), LAT = scale(LAT), change = (`2010` / `2000`) %>% log %>% scale %>% as.numeric) %>%
  column_to_rownames("CityST") %>%
  select(LON, LAT, change) %>%
  dist %>%
  hclust %>%
  dendro_data ->
  dendrogram

dendrogram %>%
  segment %>%
  ggplot() +
  geom_segment(aes(xend = xend, yend = yend)) +
  aes(x = x, y = y) +
  coord_flip() +
  scale_y_reverse(expand = c(0.2, 0)) +
  geom_text(data = dendrogram$labels, aes(label = label), adj=0, size=2)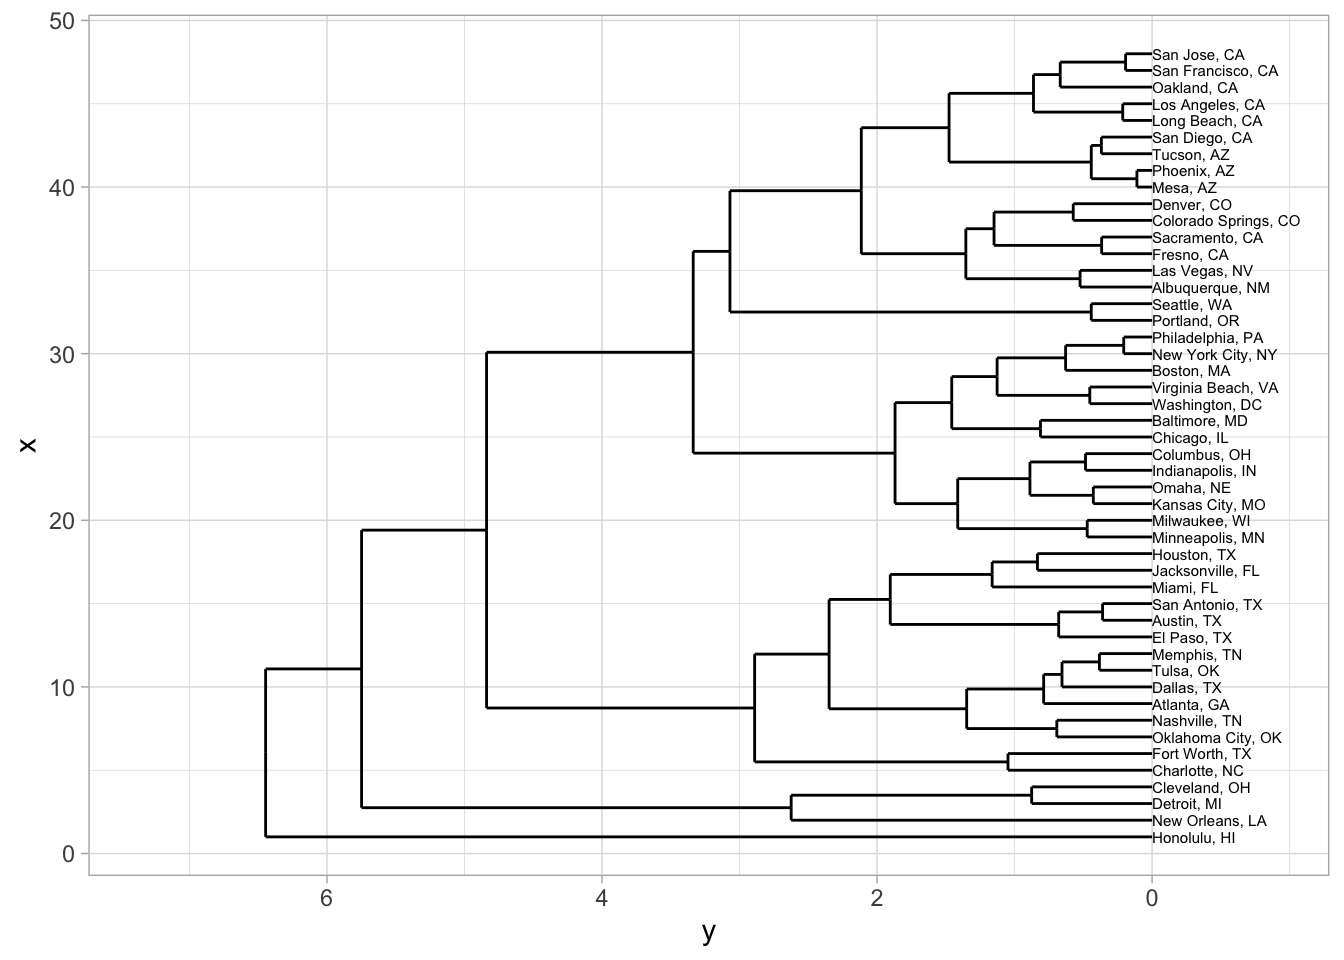
A spatialized version of texts is, just as always, a document vectorization. Let’s look again at State of the Unions. A sensible vector space way to cluster them is based on term vectors; here we’ll use a tf_idf version to filter down the impact of extremely common words. (Remember, if you leave in ‘the’ and ‘a’, they will completely dominate any spatial representation of text.)
## Skipping install of 'HumanitiesDataAnalysis' from a github remote, the SHA1 (5ce2903f) has not changed since last install.
## Use `force = TRUE` to force installation## Joining, by = "year"## Joining, by = "word"tf %>%
group_by(word) %>%
summarize(tot = sum(.tf_idf)) %>%
arrange(-tot) %>%
# Take the top 100 words by tf_idf
slice(1:100) %>%
# Join back into the original data frame--this like filtering down.
inner_join(tf) %>%
select(year, president, word, .tf_idf) %>%
mutate(id = paste(president, year)) %>%
spread(word, .tf_idf, fill = 0) -> words## Joining, by = "word"## Warning in dist(.): NAs introduced by coerciondendrogram %>%
segment %>%
ggplot() +
geom_segment(aes(xend = xend, yend = yend)) +
aes(x = x, y = y) +
coord_flip() +
scale_y_reverse(expand = c(0.2, 0)) +
geom_text(data = dendrogram$labels, aes(label = label), adj=0, size=3)
To make a dendrogram, we once again take the distances and plot a hierarchical clustering.
By making the labels be the authors, we can see whether the clusters are grouping similar people together. In this case, it turns out to do quite a good job.
But note that it’s harder in this case to determine whether the same sorts of people are clustered together.
Ceglowski, Maciej. 2015. “Haunted by Data.” October 1, 2015. https://idlewords.com/talks/haunted_by_data.htm.
Lincoln, Matthew D. 2019. “Little Package, Big Dependency. Matthew Lincoln, PhD.” January 13, 2019. https://matthewlincoln.net/2019/01/13/little-package-big-dependency.html.
Rosenberg, Daniel. 2013. “Data Before the Fact.” In Raw Data Is an Oxymoron, edited by Lisa Gitelman. Cambridge: MIT Press.
Williams, Donald C. 1936. “Tokens, Types, Words, and Terms.” The Journal of Philosophy 33 (26): 701–7. https://doi.org/10.2307/2015665.
This is a simplification–in fact, there are a number of different ways to treat the amalgamated clusters.↩︎