Correlations
How are words linked in their usage? In a way, that’s the core question of a lot of history. I think we can get a bit of a picture of this, albeit a hazy one, using some numbers. This is the first of two posts about how we can look at connections between discourses.
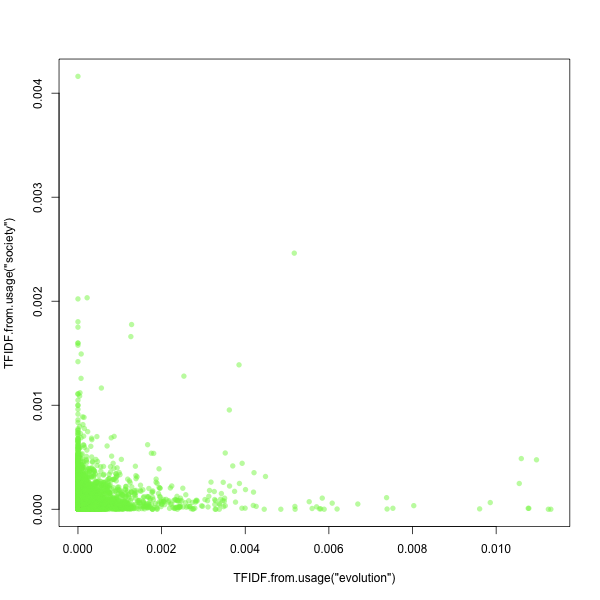
Any word has a given prominence for any book. Basically, that’s the number of times it appears. (The numbers I give here are my TF-IDF scores, but for practical purposes, they’re basically equivalent to the rate of incidence per book when we look at single words. Things only get tricky when looking at multiple word correlations, which I’m not going to use in this post.) To explain graphically: here’s a chart. Each dot is a book, the x axis is the book’s score for “evolution”, and the y axis is the book’s score for “society.”
They look pretty unrelated, but there are a few places where they get used together. We can put a number on that–the correlation is .13, where 1 is complete correlation, -1 complete negative correlation, and 0 no relationship at all. I could get it significantly higher by transforming the numbers to account for the distribution–it’s .21 if you just take the square root, eg—but I’m just playing around, here, for now. That would have to be fixed for more serious research, though.
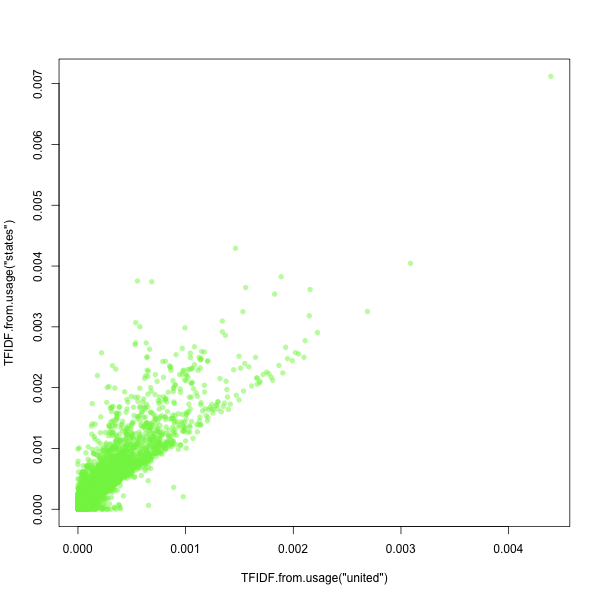
How high is a .13 correlation? It’s probably not nothing. For more highly linked word-pairs like “Lincoln–Springfield,” “Kansas–Nebraska,” or “Red-Green” the correlations are between .45 and .5. The highest score I could get was this graph, with a correlation of .91, for “united” and “states”.
It’s really hard to get a strongly negative correlation, because most words are either very common or have a lot of words down at (0,0). The best I could quickly do was -.19 for “she” and “government.” More common words have higher scores in general, which makes this a problem for absolute comparisons unless the distribution issue got fixed.
All that is kind of uninteresting, I’m sure. What isn’t: these correlations can change over time. Here’s a chart showing the relations between two words–“evolution” and “society”–from 1830 to 1922.

The zero line is incredibly important on these charts–I should probably be highlighting it somehow. It’s below before the Origin in 1859 because, I think, evolution was a word about the course of diseases and such while society was a word about the Astors. And the Astors rarely got diseased, at least on the printed page. It goes neutral right about 1860, and then makes it into the positive territory around 1880. I’m actually quite surprised to see how strongly evolution and society are linked after 1910–I would have bet the strongest correlation of the two terms would have come much later.
That’s a fuzzy line, but how important is it? Well, let’s check some more basic things. First, how do events change the correlations of people?
That’s pretty striking right in 1865. I think there are some Harper’s or Putnam’s magazines keeping the current events high. The secondary spikes are a little more mysterious to me, though, this may be quite a noisy event.
How about pairs more conceptually linked?
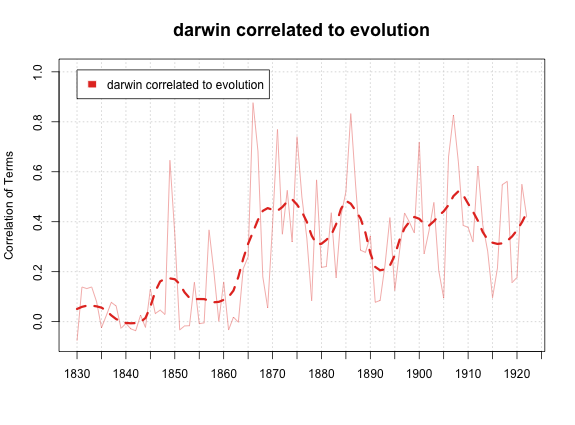
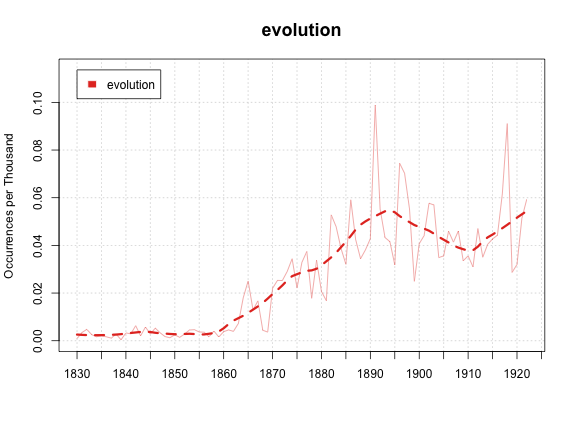
Darwin and evolution become two closely linked words from about 1865, which is right at the beginning of the takeoff for Darwinist discourse. Let me show my chart of overall occurrences “evolution” for comparison:
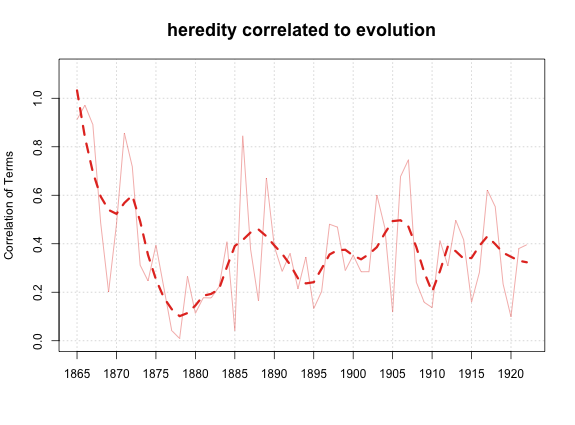
Do you see how evolution rises just as it becomes closely correlated with Darwin? That’s nice. Also interesting is that the local peak in the early 1890s lines up nicely with a lull in the strength of the Darwin-Evolution connection. That might be noise, or it might be a nice illustration of the “eclipse of Darwinism” Hank was talking about earlier. Let’s dig into that a little more, starting in 1865:
I was hoping to find a spike around the search for alternate mechanisms of heredity, but that’s not at all what we get. The huge initial peak, I think, reflects how evolution initially was just about biological heredity. As it diffused into things like like studies of society (which the chart above showed), that correlation weakened. The rebound—if that’s what it is—in the 1880s might show something of a renewed interest in hereditary mechanisms even despite all the other people talking about evolution. I think there are ways to start to address this problem by being more sophisticated in both our search terms (not just “evolution” and “heredity”, but a bunch of things designed to ferret out specifically biological evolution) and in our correlation methods. That’s what the next post in the hopper should do a little more of. Any requests for pairs of words or pairs of groups to put in it?
This isn’t perfect, I should say. I had one case that appeared not to work at all: Taylorism and efficiency. We get a couple high years in the teens, but also several in the 1840s:


Comments:
“She” and “Government” - I lov…
Hank - Jan 3, 2011
“She” and “Government” - I love it! Could you show us what that most-negative of graphs looks like? I think that might help me figure out what to look for in those initial visual renderings (though I have an idea).
There’s a lot of reaching in here, but, as I’ve said from the beginning, that’s the best. I’m with you on “Darwin” and “Evolution” (are your searches case sensitive, by the way?), but I wonder whether you might try “Evolution” and “Human,” too? That is to say, are we sure hunting around for “society” is our best bet? It might be, but I’d like to see a few other candidates to compare correlation graphs.
At a more general level, could you motivate the claim you make in your opening paragraph about this being at the intersection of (“between”) discourses? You’re not saying that the evolution discourses on diseases and the society discourses on the Astors become united, such that you get a discourse on Astor diseases…
You’re saying those discourses change, such that you’d need to account for (a) the shifts in each (from “Astors” to general society) and (b) how the new one relates to the old ones (starting to use a new sense of evolution to talk about this new sense of society). I know this isn’t 100% lucid, but I’m eagerly awaiting your second correlations post and wonder if you might take a stab on this question (such as it is) therein…
No case sensitivity anywhere in this system—I thin…
Ben - Jan 3, 2011
No case sensitivity anywhere in this system—I think that’s for the best.
The next post should get at some of the questions question about discourses and what words to use. The reason I’m using TF-IDF scores here instead of simple frequencies is that it lets us combine different words into the same scale–so we could make a first stab at finding the correlation of “society”-“astors” to “society”-“evolution”, say. It’s probably a bit of a leap from word-usage-patterns to discourses, for sure.
She and Government doesn’t look that different than “evolution”-“society” at the raw level; I really need to figure what transformation to apply. Maybe I can just put up some log-scale graphs, which make this all much more obvious. (The problem is that you have to drop out all the books that don’t have one of the words at all to do a log-transform, so you end up losing a lot of data. Maybe I shouldn’t be worried about that–appropriately transforming between distributions is definitely one of my weakest areas.)