Historical Epidemiology with Newspapers
The high resolution of newspapers shows seasonal patterns
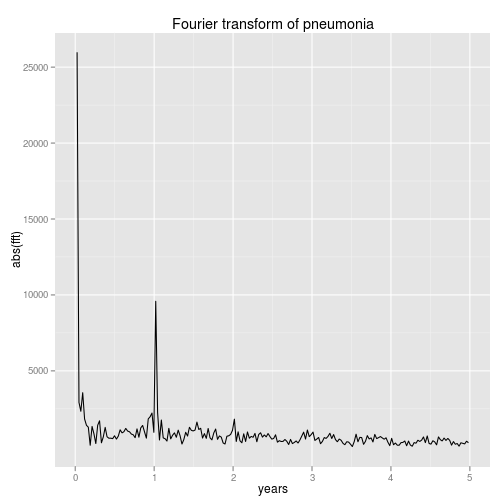
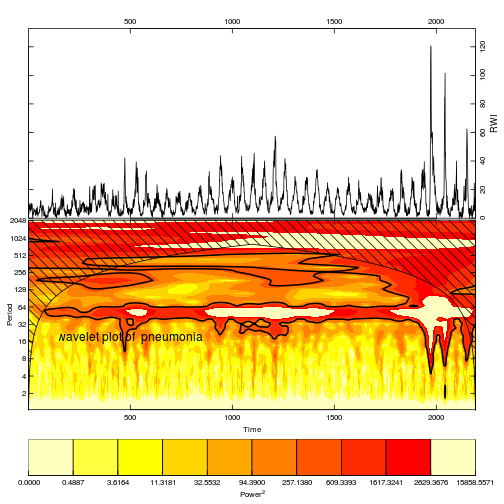
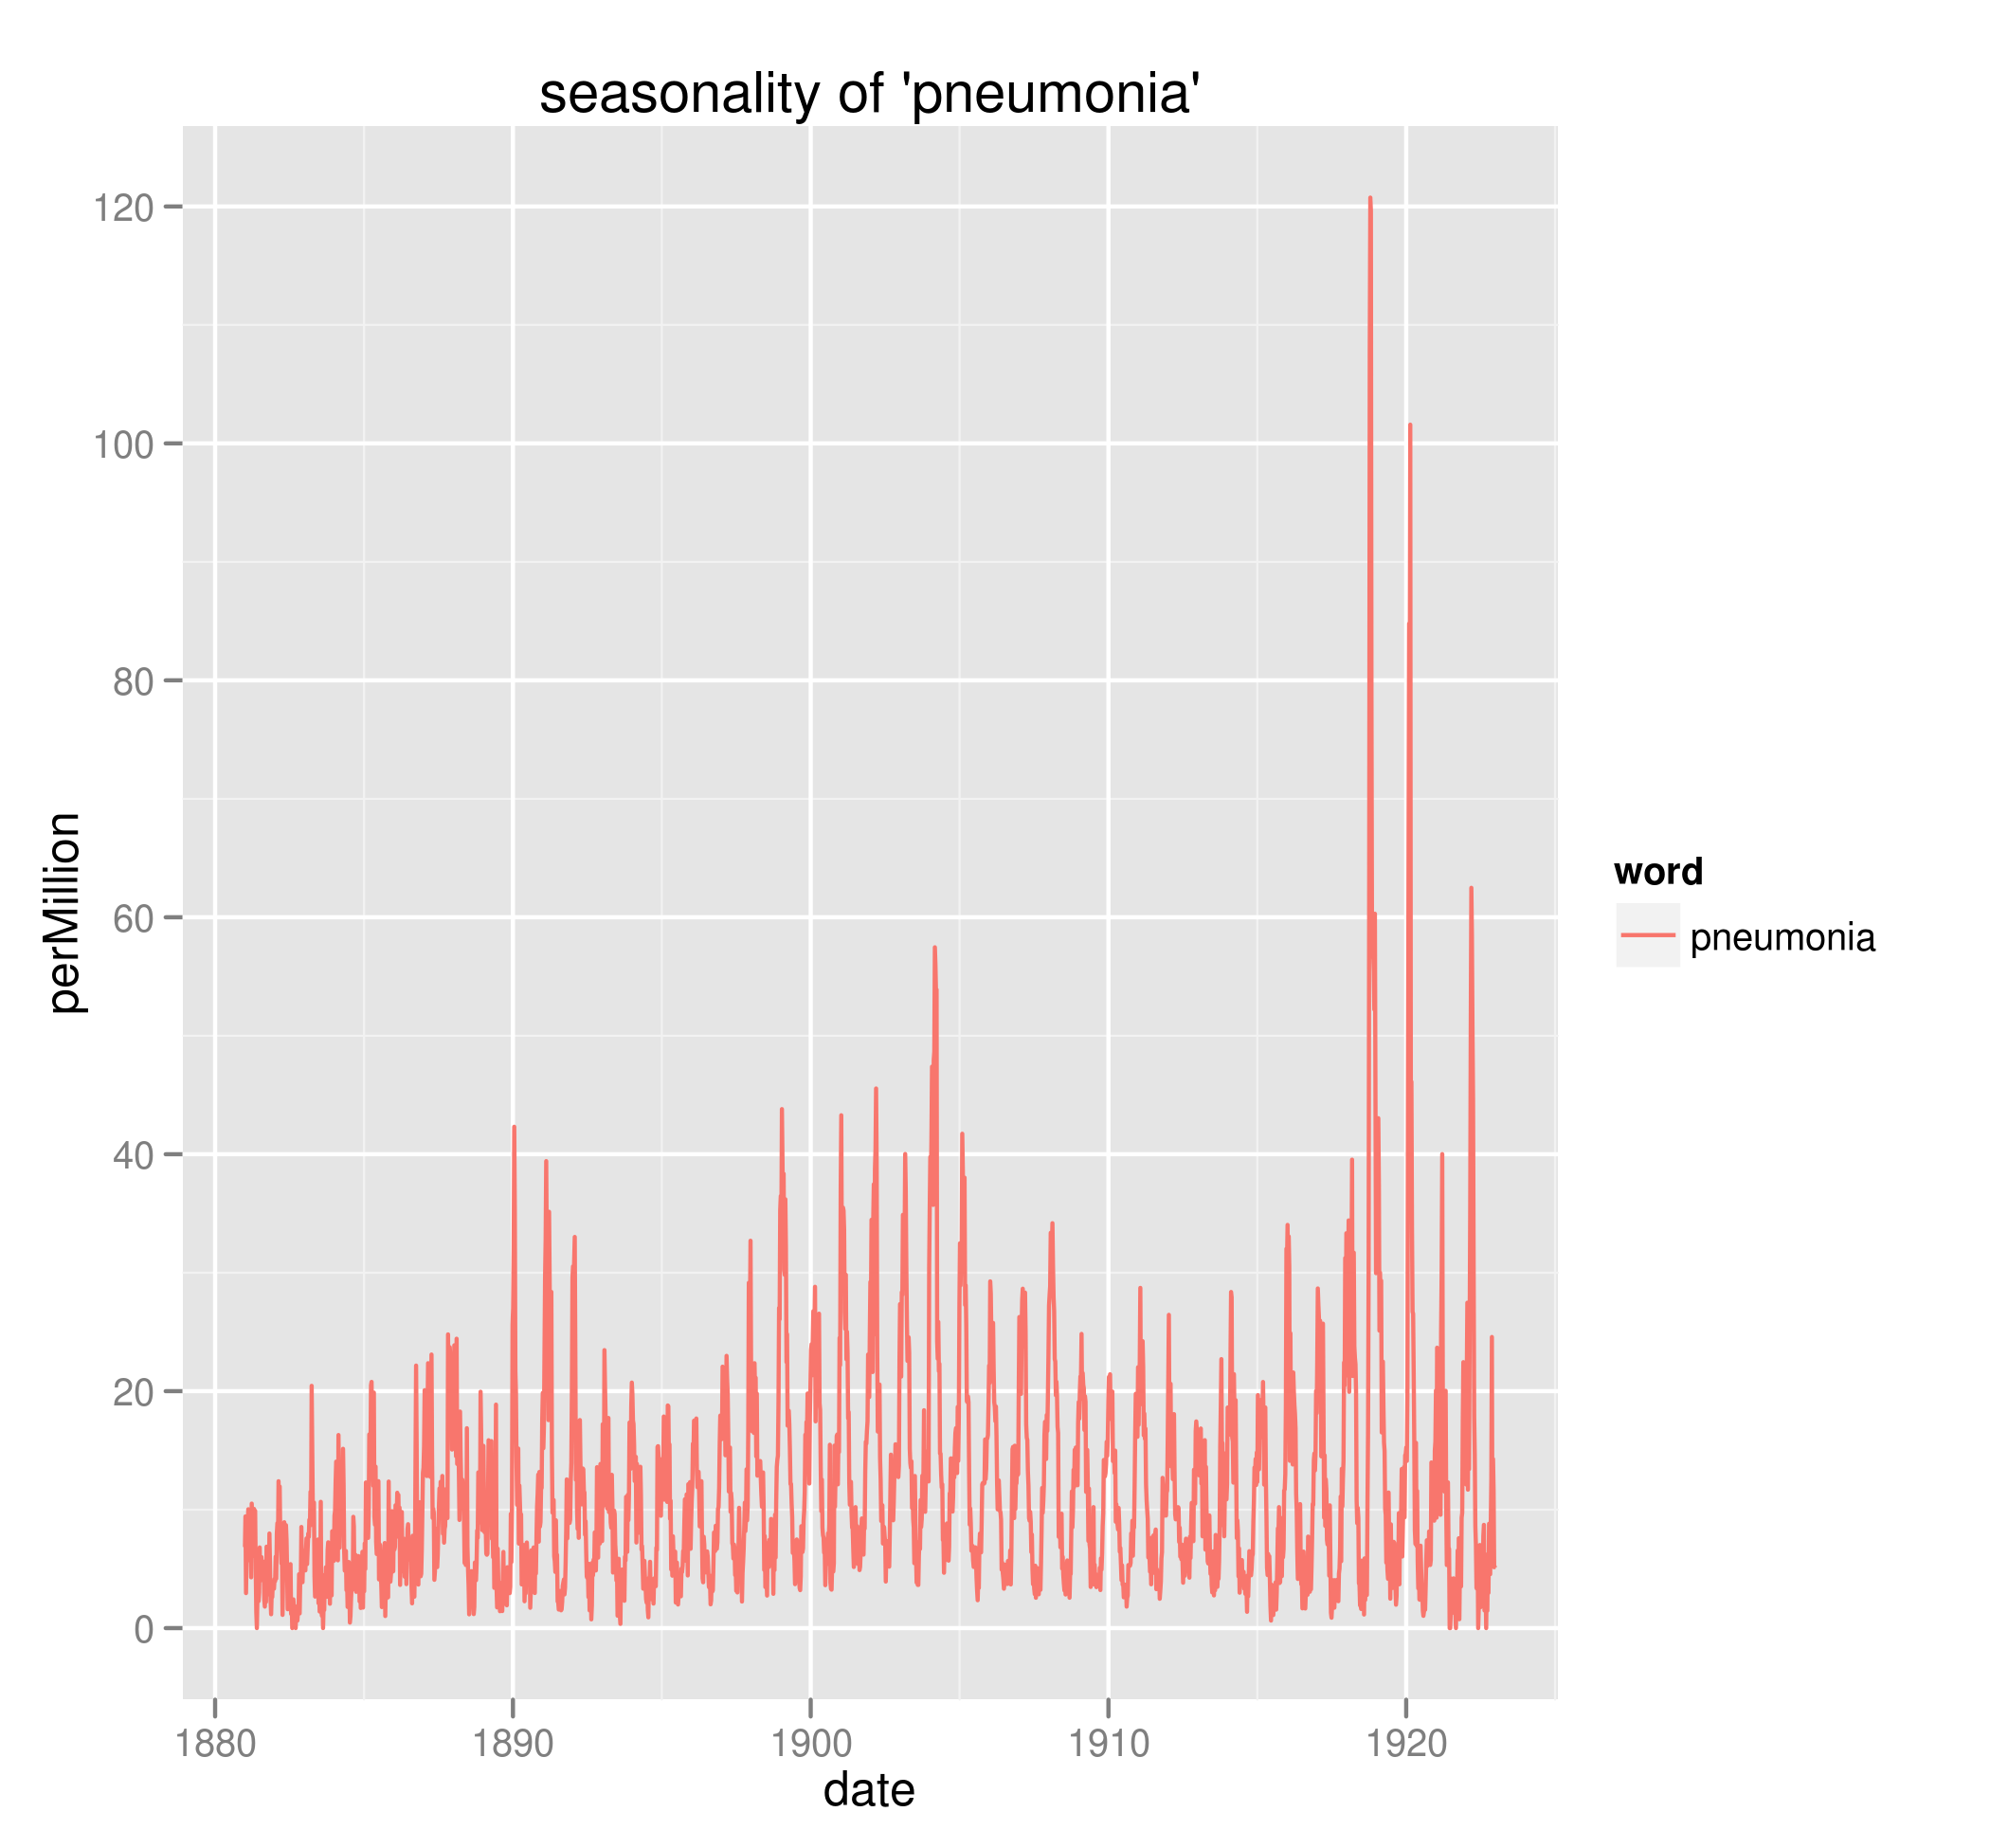 "Pneumonia" oscillates up and down each year
These patterns co-exist with strong historical signals
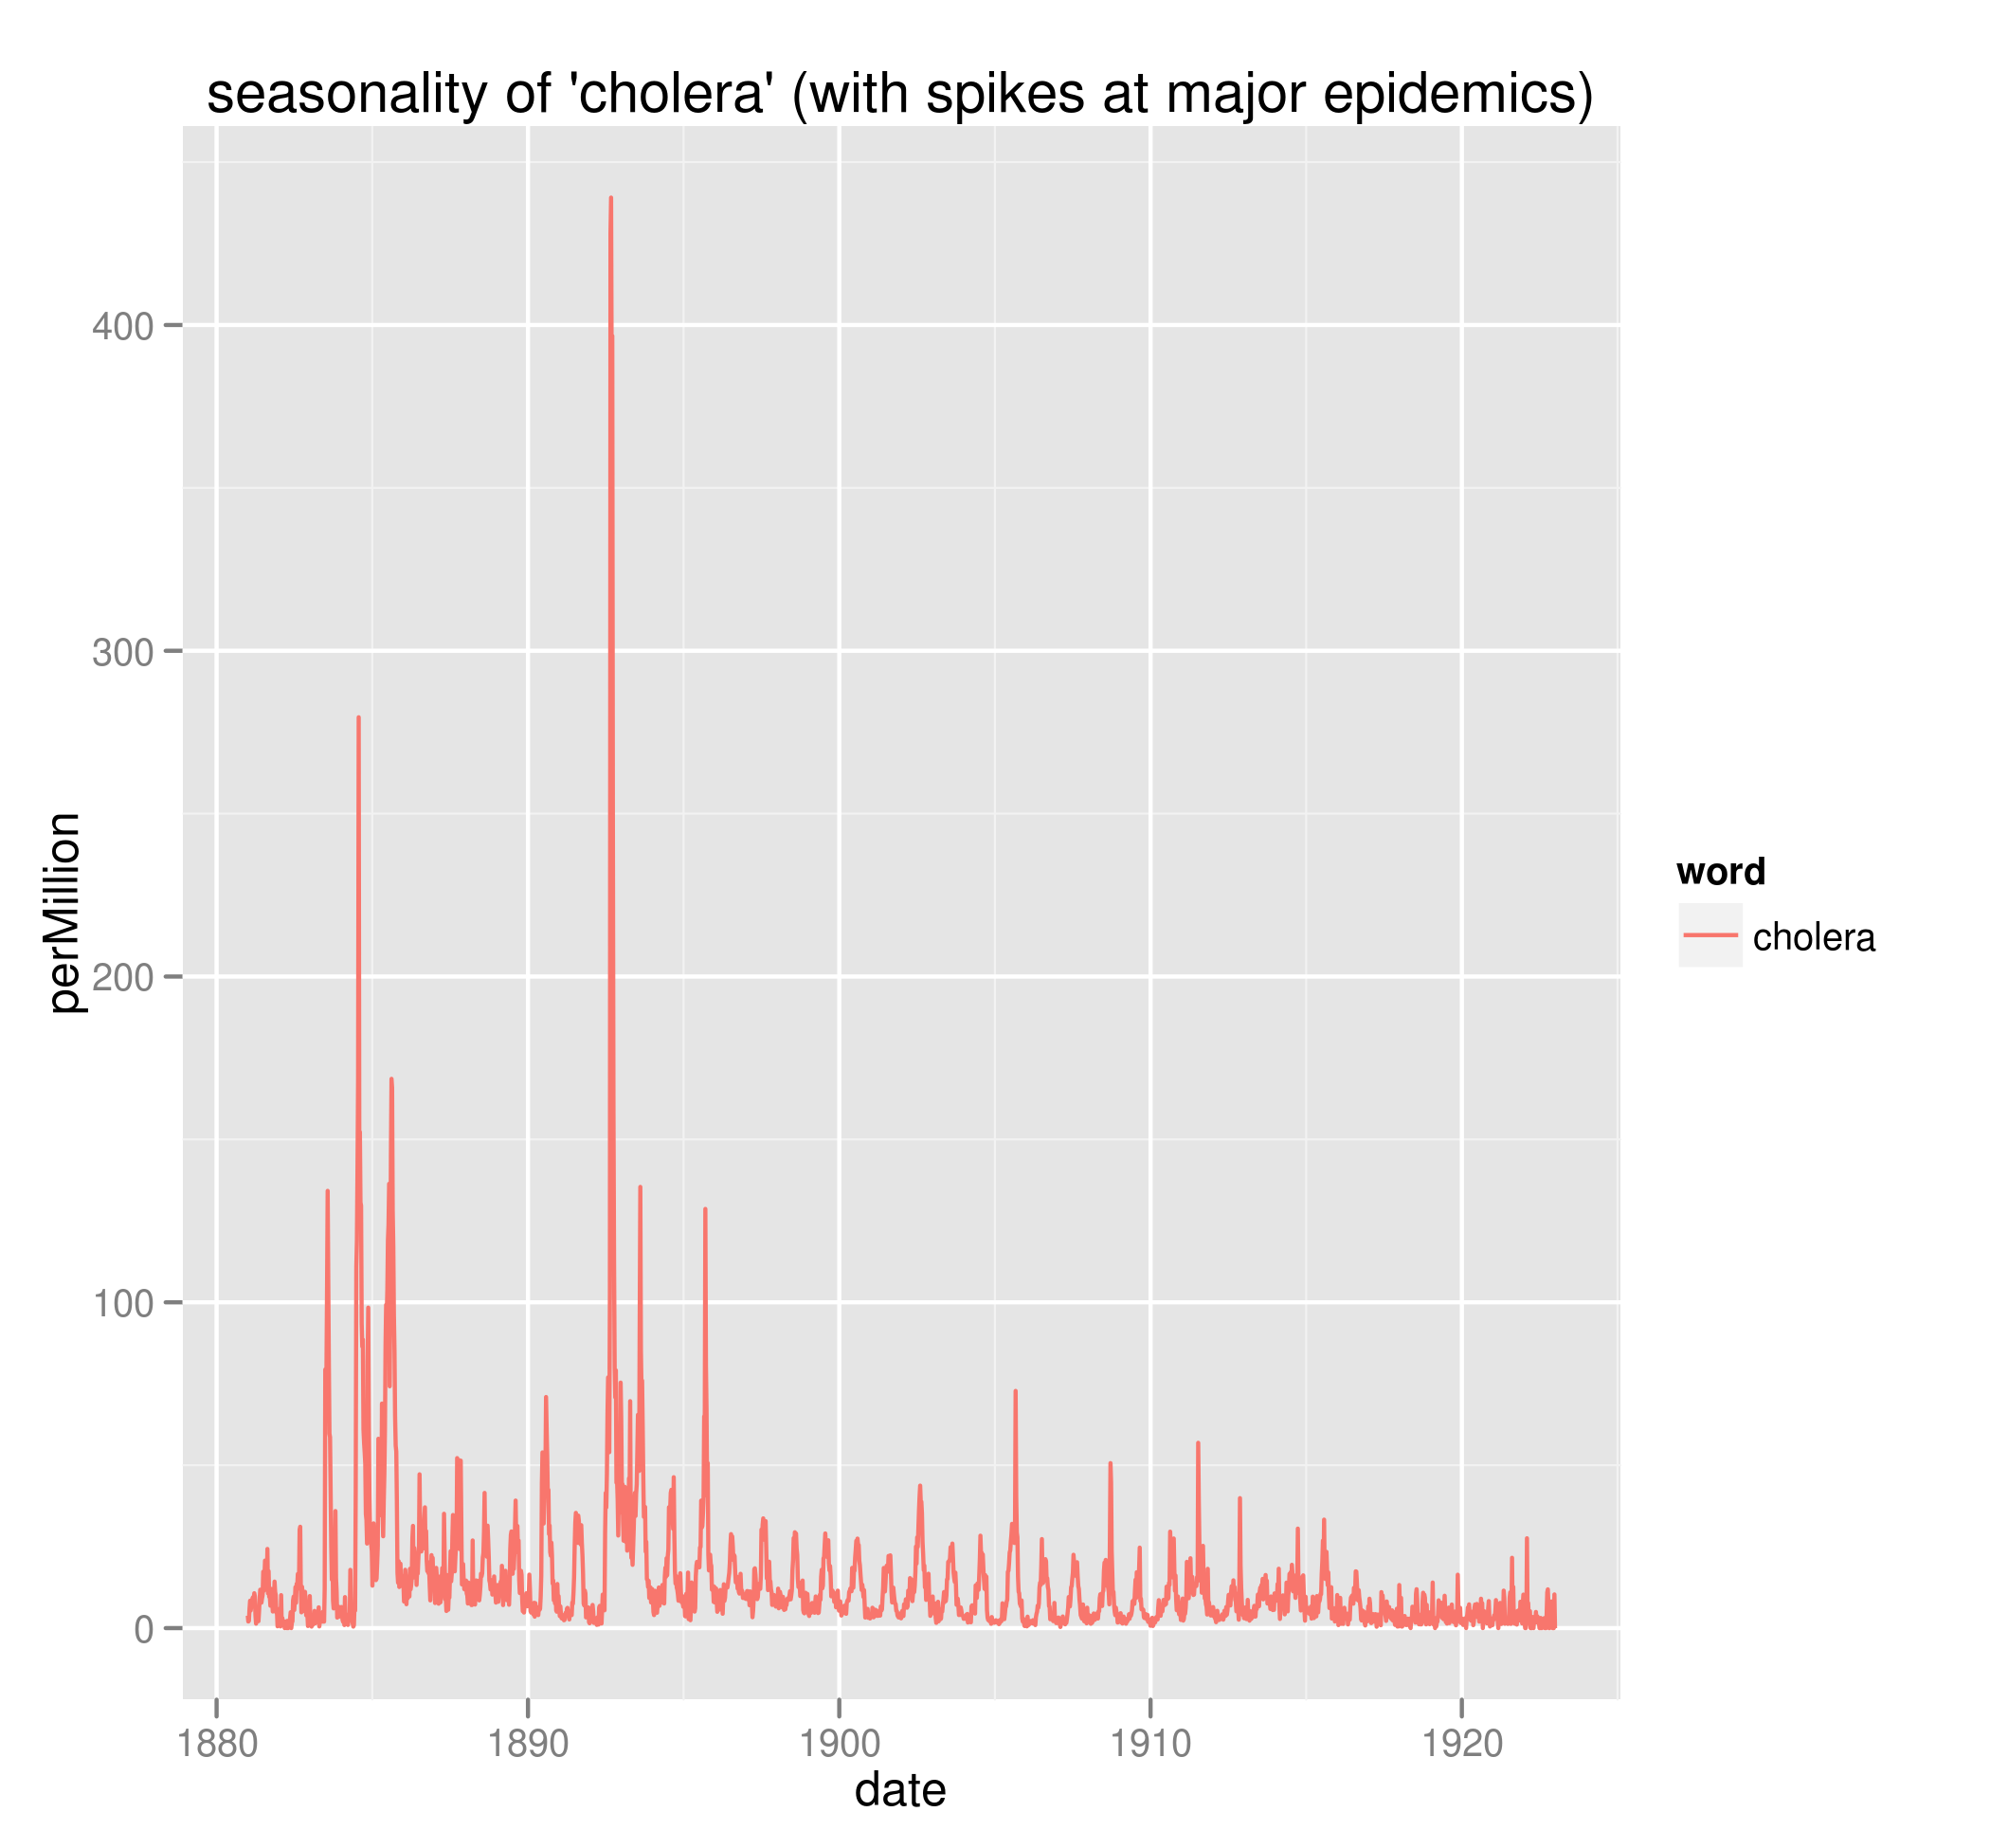
Cholera has strong seasonality, and strong signals around world epidemics (in 1886 and 1892)
Seasonal patterns give strong elements to analyze
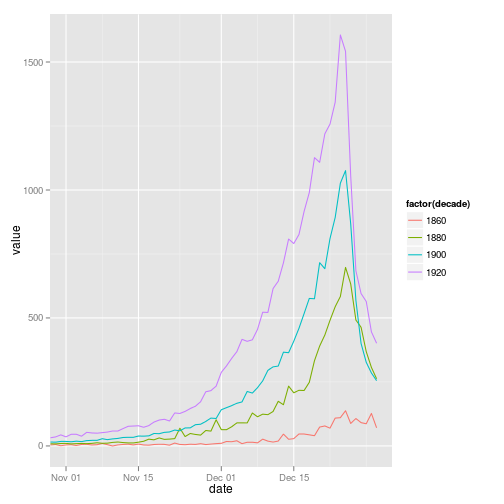
This chart, for instance, show Christmas coming earlier and stronger over time as advertising increases.
We can use this to track diseases
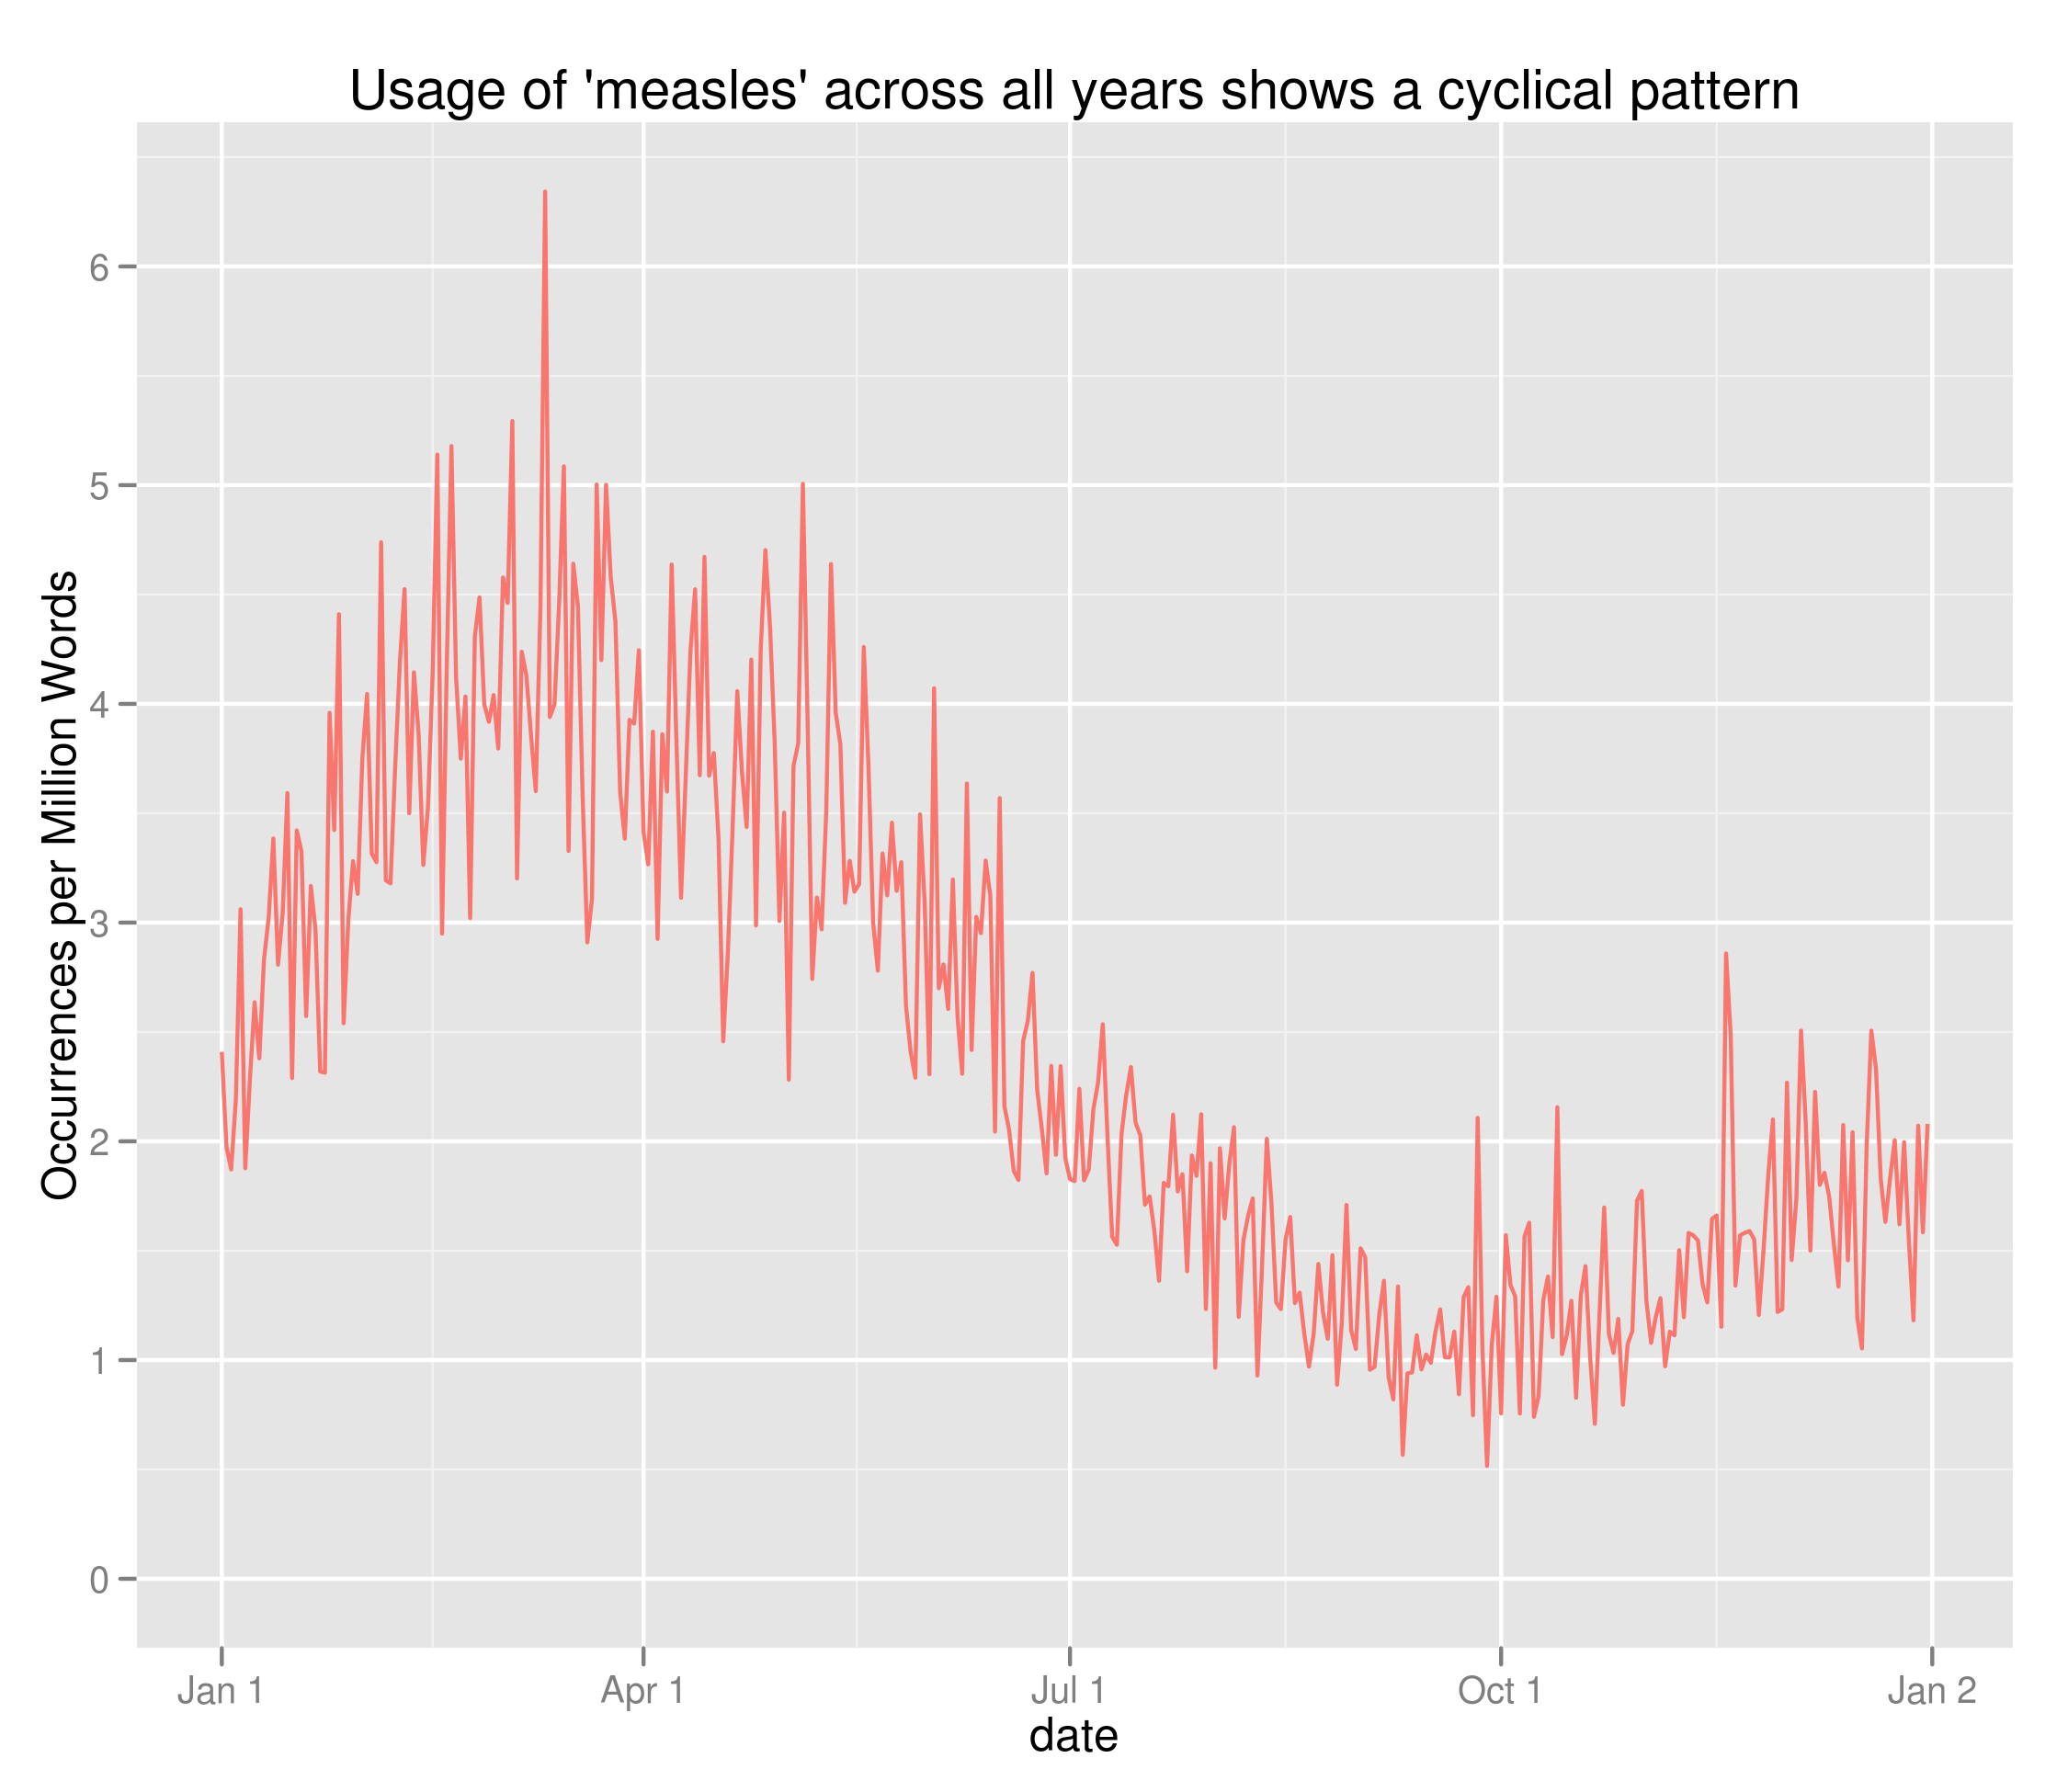
Measles shows a spike in the spring months
There are Historical Patterns
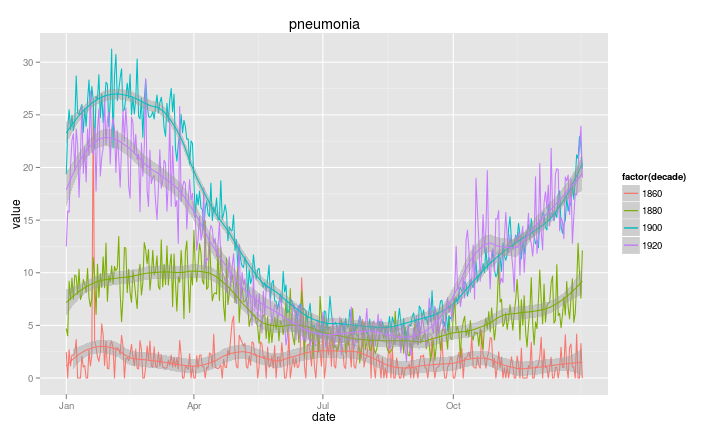
Pneumonia's peaks shift by decade
...even in cases, like Pertussis, where seasonality is an open question in the medical literature
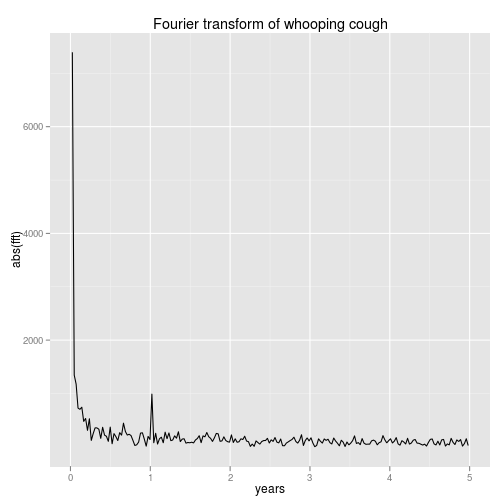
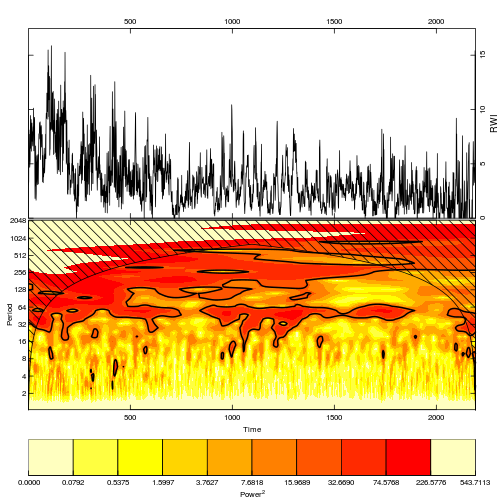
Even without data normalization, there is strong evidence of a seasonal pattern to Pertussis, and possibly some cycles of > 1 year
This contradicts the limited ground-truth data we have on Pertussis
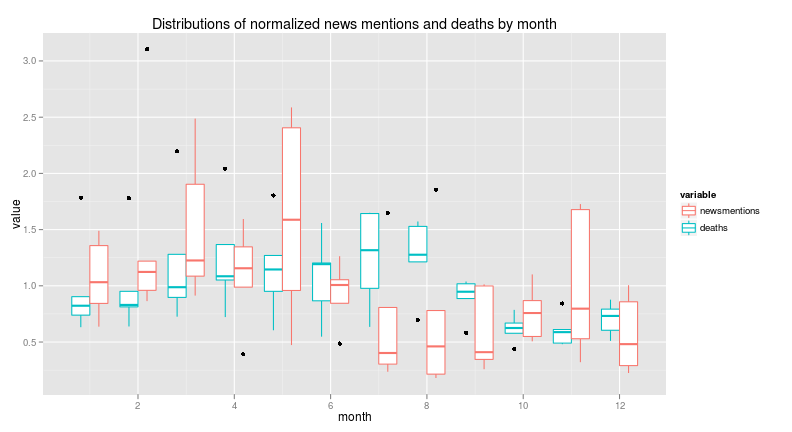

Hand entered data from US mortality reports (blue) shows much more incidence in the summer months than newspapers (red)

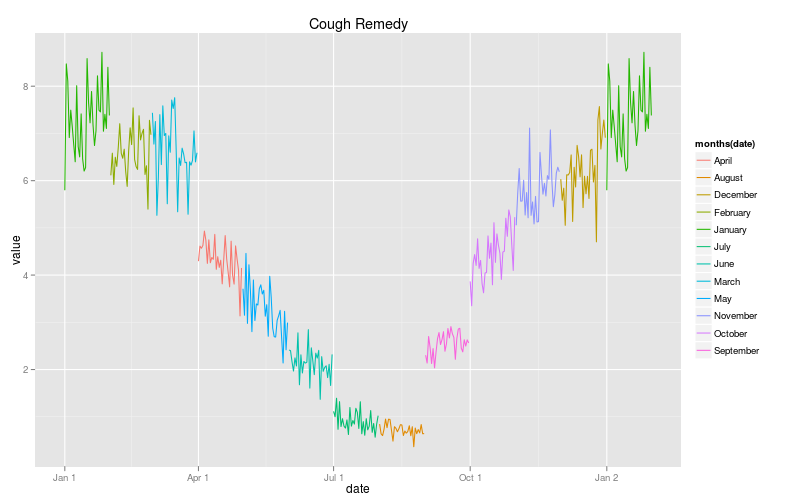
Some variation displays a step-wise pattern at the month breaks, including Whooping Cough...
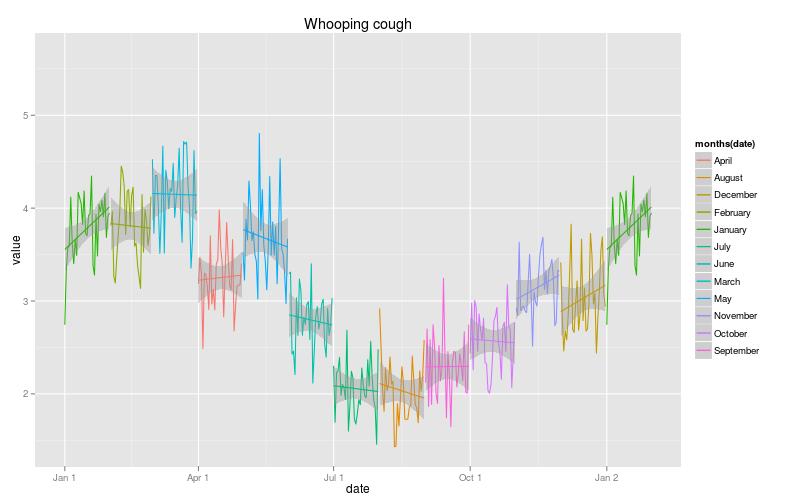
(Trend lines added for each month)
And a disease with similar symptoms, croup. But why?
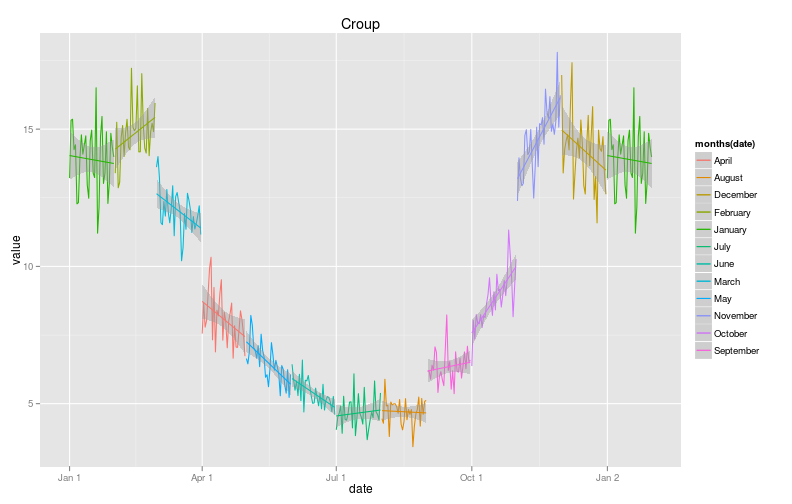
Trend lines added for each month
Answer: Advertising!
Advertisers often purchase ads by the month or quarter; cough remedies run in the winter or fall.
This highlights the importance of fully understanding source materials
By understanding these effects, it may be possible to overcome them
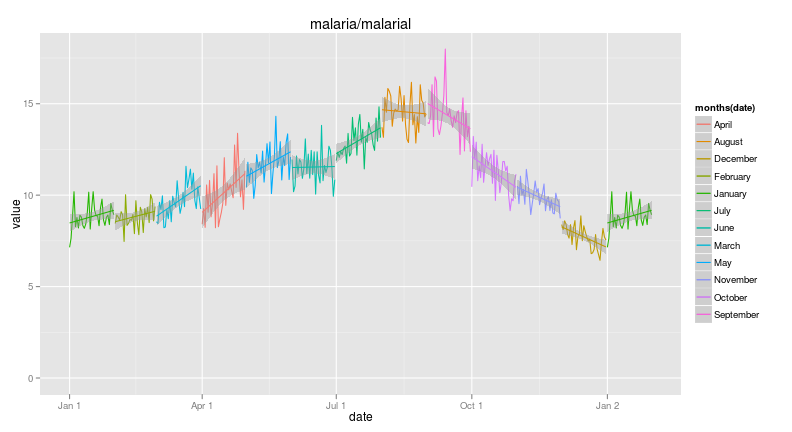
And some diseases of greater public health importance don't show advertising patterns, suggesting other promising routes for studying public health in the era before a public health infrastructure
 ←
→
←
→
/
#