Javascript and the next decade of data programming

I’ve recently been getting pretty far into the weeds about what the future of data programming is going to look like. I use pandas and dplyr in python and R respectively. But I’m starting to see the shape of something that’s interesting coming down the pike. I’ve been working on a project that involves scatterplot visualizations at a massive scale–up to 1 billion points sent to the browser. In doing this, two things have become clear:
- Computers have gotten much, much faster in the last couple decades
- Our languages for data analysis have failed to keep up.
- New data formats are making the differences between Python, R, and Javascript less important.
- Javascript, the quintessential front-end language, is increasingly becoming the back-end for data work in Python and R.
- Things will be weird, but also maybe good?
I tweeted about it once, after I had experimented with binary, serialized alternatives to JSON.
As webgpu and new binary serialization formats--like Arrow--come of age, it's going to be harder and harder to stomach geojson's slowness. More and more of R and python will become js or wasm wrappers. Just like in the 2000s they were wrappers around Java. It'll be very weird.
— Benjamin Schmidt (@benmschmidt) December 23, 2020
I’m writing about Python and R because they’re completely dominant in the space of data programming. (By data programming, I mean basically ‘data science’; not being a scientist, I have trouble using it to describe what I do.) Some dinosaurs in economists still use Stata, and some wizards use Julia, but if you want to work with data that’s basically it. The big problem with the programming lessons we use to work with data they run largely on CPUs, and often predominantly on a single core. This has always been an issue in terms of speed; when I first switched to Python around 2011, I furiously searched ways around the GIL (global interpreter lock) that keeps the language from using multiple cores even on threads. Things have gotten a little better on some fronts–in general, it seems like at least linear algebra routines can make use of a computer’s full resources.
JS/HTML is the low-level language for UI and Python and R.
Separately, the graphical and interface primitives of all programs have started to move to the web. If I had started doing this kind of work seriously even a couple years later, I would never even have noticed there used to be another way. I never really used tcl/tk interfaces in R, but I was always aware that they existed; the very first version, private version of the Google Ngrams browser that JB Michel wrote in like 2008 or something was built around some Python library. This was normal. But in the last decade, it’s become obvious that if you want to build user-facing elements to describe something like “a button” or “a mouseover”, the path of least resistance is to use the HTML conception, not the operating system conception of them. The fifteen-year-old freshman who built the first Bookworm UI quickly saw it needed a javascript plotting library. This integration is becoming tighter and tighter in data programming land. I have collaborators and grad students who transition seamlessly into bundling their R packages into Shiny apps, into decorating their Google colab notebooks with all sorts of sliders and text entry fields, into publishing R and Python code as online books with HTML/JS navigation.
Jupyter notebooks and the RStudio IDE themselves are part of this transformation; what appears to be Python code held together by an invisible skein of Javascript. Again, these are platforms that have more or less displaced earlier models. When I first learned R, I pasted from textedit into the core R GUI; I went a little down the road into ESS-mode in emacs as well. But if you need to continually be checking random samples of a dataframe, re-running modules, and seeing if your regular expressions correctly clean a dataset, you are using a notebook interface today, even if you bundle your code into a module at some point.
And for visualization, Javascript is creeping into this space. Like many people,
I’ve been relieved to be able to use Altair instead of matplotlib for
visualizing pandas dataframes; and I don’t think twice about dropping
ggplotly into lessons about ggplot for students who start wondering about
tooltips on mouseover. ggplot and matplotlib are still king of the roost
for publication-ready plots, but after becoming accustomed to interactive,
responsive charts on the web, we are coming to expect exploratory charts to
do the same thing; just as select menus and buttons from HTML fill this role
in notebook interface, JS charting libraries do the same for chart interface.
The GPU-laptop interface is an open question
Let me be clear–something I’ll say in this following section is certainly wrong. I’m not fully expert in what I’m about to say. I don’t know who is! There are some analogies to web cartography, where I’ve learned a lot from Vladimir Agafonkin. Many of the tools I’m thinking about I learned about in a set of communications with Doug Duhaime and David McClure. But the field is unstable enough that I think others may stumble in the same direction I have.
This whole period, GPUs have also been displacing CPUs for computation. The R/Python interfaces to these are tricky. Numba kind of works; I’ve fiddled with gnumpy from time to time; and I’ve never intentionally used a GPU in R, although it’s possible I did without knowing it. The path of least resistance to GPU computation in Python and R is often to use Tensorflow or Torch even for purposes that don’t really a neural network library–so I find myself, for example, training UMAP models using the neural network interface rather than the CPU one even though I’d prefer the other.
Most of these rely on CUDA to access GPUs. (When I said I don’t know what I’m talking about–this is the core of it.) If you want to do programming on these platforms, you increasingly boot up a cloud server and run heavy-duty models there. Cuda configuration is a pain, and the odds are decent your home machine doesn’t have a GPU anyway. If you want to run everything in the cloud, this is fine–Google just gives away TPUs for free. But doing a group-by/apply/summarize on a few million rows, this is overkill; and while cloud compute is pretty cheap compared to your home laptop, cloud storage is crazy expensive. Digital Ocean charges me like a hundred dollars a year just to keep up the database backing RateMyProfessor; for the work I do on several terabytes of data from the HathiTrust, I’d be lost without a university cluster and the 12TB hard drive on my desk at home.
But I want these operations to run faster.
Javascript is already fast, even without its GPU.
When I started using webgl to make charts in Javascript, I was completely blown away what it could do. I’m used to sitting around waiting for ggplot to render even a few thousand points. I’m used to polygon operations in geopandas being long and expensive. I’m used to getting up to get some tea when I want to load a geojson file.
But I could use javascript to generate millions of points in random polygons from primitive triangles in barely any time; and then using regl it can animate fast enough to make seamless zooming reasonable. Here, for example, is every single vote (excluding absentee) in New York City precincts in the 2020 election. (Hopefully this embed from Observable loads… but if it doesn’t, well, that’s the kind of the point, too. I’m making you click below to avoid clobbering people on phones.)
Digging into the weeds to make more elaborate visualizations like this, I can see why. Apache Arrow exposes an extremely low level model of the data you work with, that encourages you to think a lot about both the precise schema and the underlying types. In Python, I’ve gotten used to this kind of work in numpy; in R, I’ve only ever done a little bit a bit twiddling. But in modern JS, binary array buffers are built right into the language. When I started tinkering with JS, I thought of it as slow; but web developers are far more obsessive about speed than any other high-level, dynamically typed language I’ve seen. The profiling tools built into Chrome are incredibly powerful; and Google, especially, has made a huge investment in making JS run incredibly quickly because there’s huge money in frictionless web experience. Sure, lots of websites are slow because they come with megabyte-sized React installations and casual bloat; sure, the DOM is slow to work with. But Javascript itself is fast.
In my first few years teaching digital humanities, probably the least thankful task was helping students manage their local Java installations so they could run Mallet, the best implementation of topic-modeling algorithm out there. Now, we usually use slower and inferior implementations in gensim, structural topic models, and the like. (For an interesting discussion from Ted Underwood and Yoav Goldberg of how inferior results in gensim and sklearn came to displace mallet, see the Twitter threads here.) But as David Mimno, who keeps Mallet running, says, Javascript works much faster.
Finally, integrate algorithms with interface. The browser is a high performance computing environment (JavaScript is MUCH faster than Python) embedded in an excellent interactive graphics environment. Plus there’s a code environment hidden underneath! Print those variables!
— David Mimno (@dmimno) October 26, 2020
And while Javascript has a reputation as a terrible language, the post ES2015
iterations have made it in many cases relatively easy to program with.
Maps, sets, for ... of ... all work much like you’d expect (unlike the days
when I spent a couple hours hunting out a rarely occuring bug in one data
visualization that turned out to occur when I was making visualizations of
wordcounts that included the word constructor somewhere in the vocabulary);
and many syntactic features like classes, array destructuring, and arrow
function notation
are far more pleasant than their Python equivalents. (Full disclosure–even
after a decade in the language, I still find Python’s whitespace syntax
gimmicky and at heart just don’t like the language. But that’s a post for
another day.)
Javascript with WebGL is crazy fast.
And if javascript is fast, WebGL is just bonkers in what it can do. Want to lay out two million points in a peano curve in a few milliseconds? No problem–you can even regenerate every single frame.
And WebGL uses floating-point buffers that are the same as those in Apache Arrow, so you copy blocks of data straight from disk (or the web) into the renderers without even having to do that (still fast) javascript computation. It’s difficult, and easy to do wrong. (I’ve found regl pitched at the perfect level of abstraction, but I still occasionally end up allocating thousands of buffers on the GPU every frame where I meant to only create one persistent one).
In online cartography, protobuffer-based vector files do something similar in
libraries like mapbox.gl and deck.gl. The overhead of JSON-based formats
for working with cartographic data is hard to stomach once you’ve seen how
fast, and how much more compressed, binary data can be.
WebGL is hell on rollerskates
In working with WebGL, I’ve seen just how fast it can be. For things like array smoothing, counting of points to apply complicated numeric filters, and group-by sums, it’s possible to start applying most of the elements of the relational algebra on data frames in a fully parallelized form.
But I’ve held back from doing so in any but the most ad-hoc situations because WebGL is also terrible for data computing. I would never tell anyone to learn it, right now, unless they completely needed to. Attribute buffers can only be floats, so you need to convert all integer types before posting. In many situations data may be downsized to half precision points, and double-precision floating points are so difficult that there are entire rickety structures built to support them at great cost Support for texture types varies across devices (Apple ones seem to pose special problems), so people I’ve learned from like Ricky Reusser go to great lengths to support various fallbacks. And things that are essential for data programming, like indexed lookup of lists or for loops across a passed array, are nearly impossible. I’ve found writing complex shaders in WebGL fun, but doing so always involves abusing the intentions of the system.
WebGPU and wasm might change all that
WASM and the Javascript Virtual Machine
But the last two pieces of the puzzle are lurking on the horizon. Web Assembly–
wasm files–give another way to write things for the javascript virtual machine
that can avoid the pitfalls of Javascript being a poorly designed language.
A few projects that are churning along in Rust hold the promise of making in-browser
computation even faster. (If I were going to go all-in on a new programming language
for a few months right now, it would probably be Rust; in writing webgl programs
I increasingly find myself doing the equivalent of writing my own garbage collectors,
but as a high-level guy I never learned enough C to really know the basic concepts.)
Back in the 2000s, the python and R ecosystems were littered with packages
that relied on the Java virtual machine in various ways. In the 2010s, it felt
to me like they shifted to underlying C/C++ dependencies. But given how much
effort is going into it, I think we’ll start to see things use the Javascript
Virtual Machine more and more. When I want to use some of D3 spherical projections
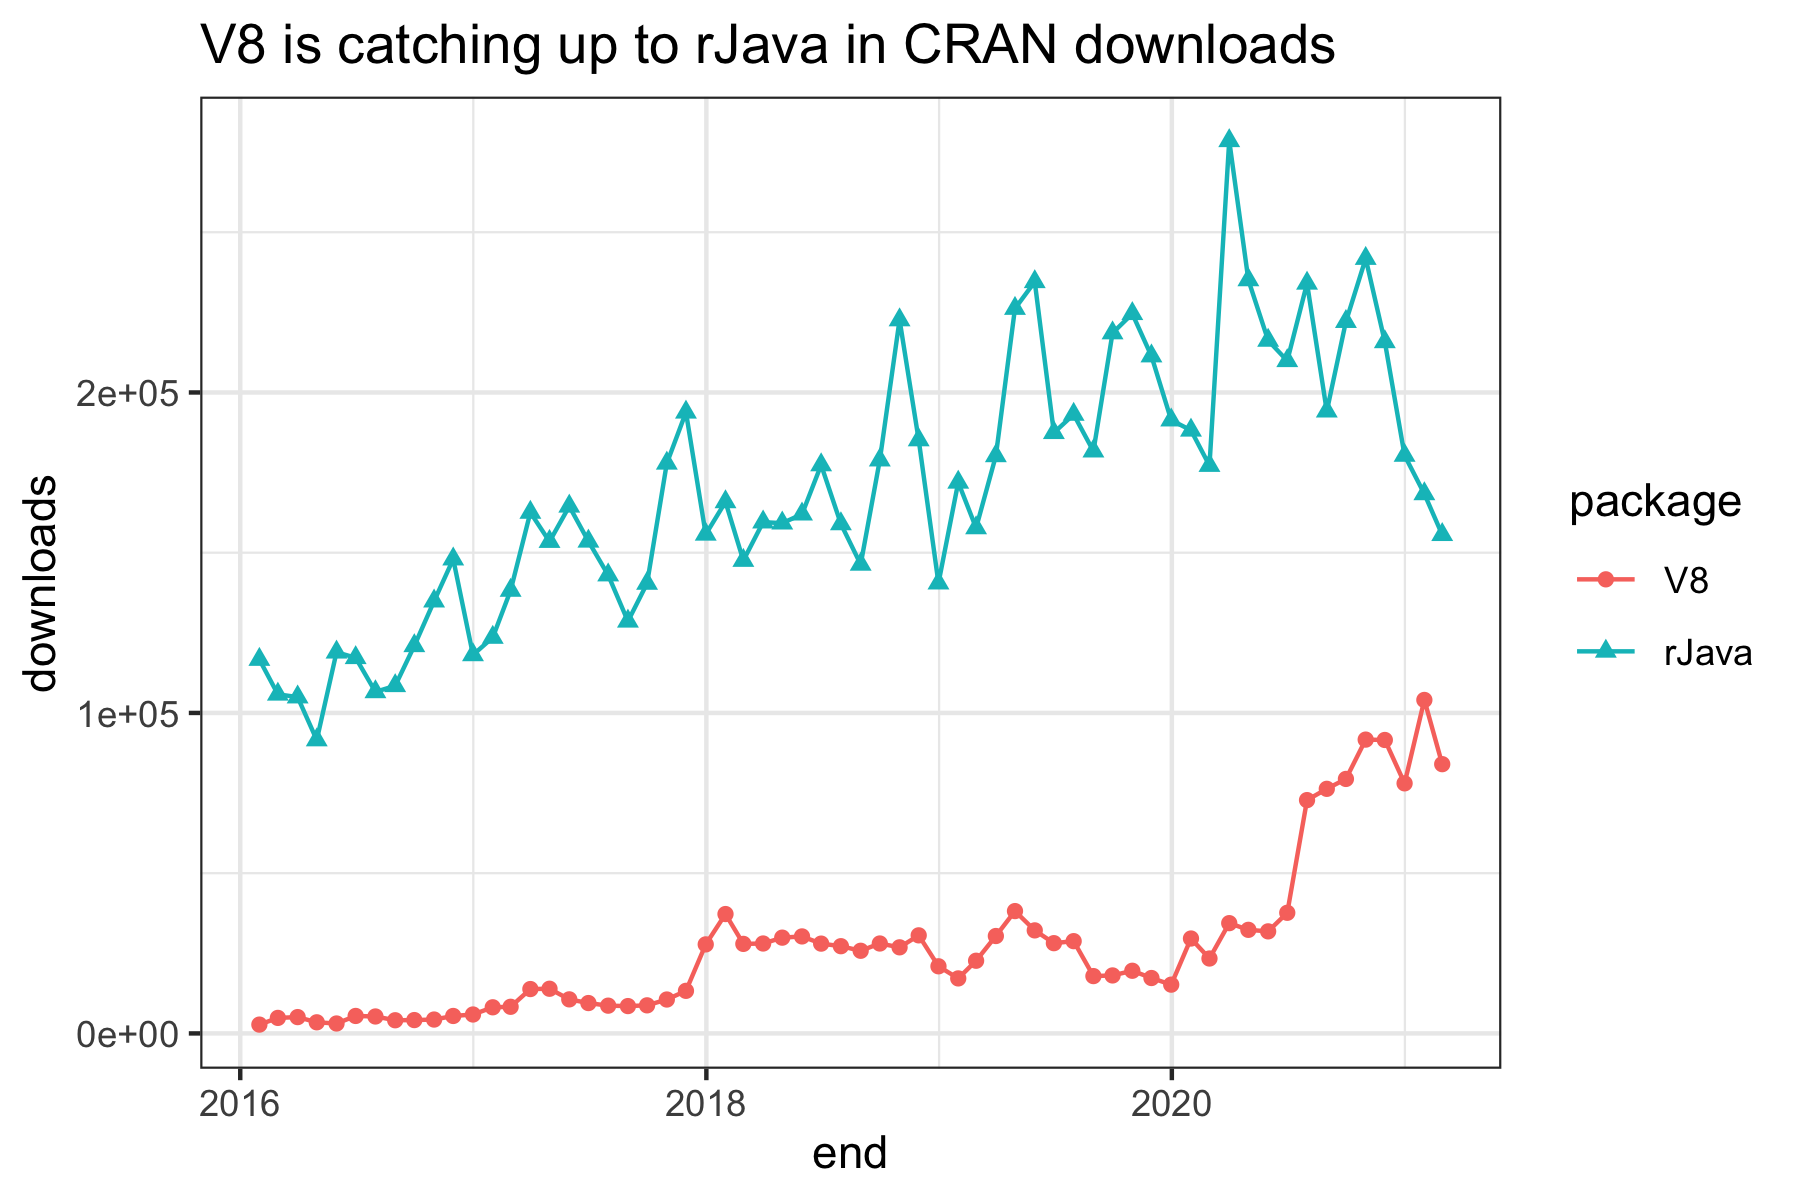
in R, that’s how I call them; and Jerome Ooen’s V8 package (for running the JSVM,
or whatever we call it) is approaching the same level of downloads as the
more venerable rJava. I suspect almost all of this is running just Javascript.
If it starts becoming a realistic way to run pre-compiled
Rust and C++ binaries on any system… that’s interesting.
WebGPU
The last domino is a little off, but could be titanically important. WebGL is slowly dying, but the big tech companies have all gotten together to create WebGPU as the next-generation standard for talking to GPUs from the browser. It builds on top of the existing GPU interfaces for specific devices (Apple, etc.) like Vulkan and Metal, about which I have rigorously resisted learning anything.
WebGPU will replace WebGL for fast in-browser graphics. But the capability to do heavy duty computation in WebGL is so tantalizing that some lunatics have already begun to do it. The stuff that goes on into Reusser’s work] is amazing; check out this notebook about “multiscale Turing patterns” that creates gorgeous images halfway between organic blobs and nineteenth-century endplates
I haven’t read the draft WebGPU spec carefully, but it will certainly allow a more robust way to handle things. There is already at least one linear algebra library (i.e., BLAS) for WebGPU out there. I can only imagine that support for more data types will make many simple group-by-filter-apply functions plausible entirely in GPU-land on any computer that can browse the web.
When I started in R back in 2004, I spent hours tinkering with SQL backing for what seemed at the time like an enormous dataset: millions of rows giving decades of data about student majors by race, college, gender, and ethnicity. I’d start a Windows desktop cranking out charts before I left the office at night, and come back to work the next morning to folders of images. Now, it’s feasible to send an only-slightly-condensed summary of 2.5 million rows for in-browser work and the whole dataset could easily fit in GPU memory. In general, the distinction between generally available GPU memory (say, 0.5 - 4GB) and RAM (2-16GB) is not so massive that we won’t be sending lots of data there. Data analysis and shaping is generally extremely parallelizable.
JS and WebGPU will stick together
Once this bundle gets rolling, it will much faster and more convenient than python/R, and in many cases it will be able to run with zero configuration. The Arquero library, introduced last year, already brings most of the especially important features of the dplyr or pandas API into observable at a nearly comparable speed. With tighter binary integration or a different backend, it–or something like it– could easily become the basic platform for teaching the non-major introduction to data science course all of the universities are starting to launch. Even if it didn’t, the vast superiority of Javascript over R/Python for both visualization speed (thanks to GPU integration) and interface (thanks to the uniquity of HTML5) means that people will increasinly bring their own data to websites for initial exploration first, and may never get any farther. (If I were going to short public companies based on the contents of these speculations, I’d start with NVidia–whose domination of the GPU space is partially dependent on CUDA being the dominant language, not WebGPU, and ESRI, which is floundering as it tries to make desktop software that does what web browsers do easily.)
Once these things start getting fast, the insane overhead of parsing CSV and JSON, and the loss of strict type definitions that they come with, will be far more onerous. Something–I’d bet on parquet, but there are are possibilities involving arrow, HDF5, ORC, protobuffer, or something else–will emerge as a more standard binary interchange format.
Why bother with R and Python?
So–this is the theory–the data programming languages in R and Python are going to rely on that. Just as they wrap Altair and they wrap HTML click elements, you’ll start finding more and more that the package/module that seems to just work, and quickly, that the 19-year-olds gravitate towards, runs on the JSVM. There will be strange stack overflow questions in which people realize that they have an updated version of V8 installed which needs to be downgraded for some particular package. There will python programs that work everywhere but mysteriously fail on some low-priced laptops using a Chinese startup’s GPU. And there will be things that almost entirely avoid the GPU because they’re so damned complicated to implement that the Rust ninjas don’t do the full text, and which–compared to the speed we see from everything else–come to be unbearable bottlenecks. (From what I’ve seen, Unicode regular expressions and non-spherical map projections seem to be a likely candidate here.)
But it will also raise the question of why we should bother to continue in R and Python at all. Javascript is faster, and will run anywhere, universally, without the strange overhead of binder notebooks and the cost of loading data in the cloud. WASM ports of these languages that run inside the JSVM will help, but ultimately get strange. (Will you write python code that gets transpiled in the browser to WASM, and then invokes its own javascript emulator to build an altair chart?) Beats me!
But I’ve already started sharing elementary data exercises for classes
using observablehq, which provides a far more coherent
approach to notebook programming than Jupyter or RStudio. (If you haven’t
tried it–among many, many other things, it parses the dependency relations between cells in a notebook
topologically and
avoids the incessant state errors that infect expert and–especially–novice
programming in Jupyter or Rstudio.) And if you want to work with data
rather than write code, it is almost as refreshing as the moment in computer history it
tries to recapitulate, the shift from storing business data in COBOL to
running them in spreadsheets. The tweet above that forms of the germ of this
rant has just a single, solitary like on it; but it’s from Mike Bostock, the creator
of D3 and co-founder of Observable, and that alone is part of the reason I
bothered to write this whole thing up. The Apache Arrow platform I keep rhapsodizing about
is led by Wes McKinney, the creator of pandas, who views it as the germ of a faster, better pandas2,
from a position initially sponsored by RStudio and subsequently with funding
from Nvidia. Speculative as this all
is, it’s also–aside from massive neural-network gravitational of the tensorflow/torch solar systems–
where the tools that become hegemonic in the last decade are naturally drifting.
(Not to imply that Javascript is anywhere near the top of the Arrow project’s priority list, BTW. It isn’t.)
I wish more of the data analysts, not just the insiders, saw this coming, or were excited that it is.
As I said, I’ve been doing some of this programming since 2003 or so, and been putting in my regular rounds most days since 2010. In that time I’ve come to see that I what I want to see most–fully editable, universally runnable, data analysis on open data–is not a universal code. Some people just want static charts. Some people want to hide their data. Most readers don’t want to tweak the settings. And everyone looks down on people who like Javascript. But it’s also the case that the web was first built in the 90s to share complicated academic work and make it editable by its readers. Even if most of academia and much of the media is devoted to one-way flows of information, and much of the post-social media Internet is a blazing hellscape, I’m excited about these shifts in the landscape precisely because they hold out the possibility that some portion of the Web might actually live up to its promise of making it easier to think through ideas.
Ben Schmidt
Director of Digital Humanities and Clinical Associate Professor of History
I am a digital historian and Director of Digital Humanities at NYU.