

Finding sources means knowing the traditions you're working in:
- And pulling together unlikely elements


Actual Appearance
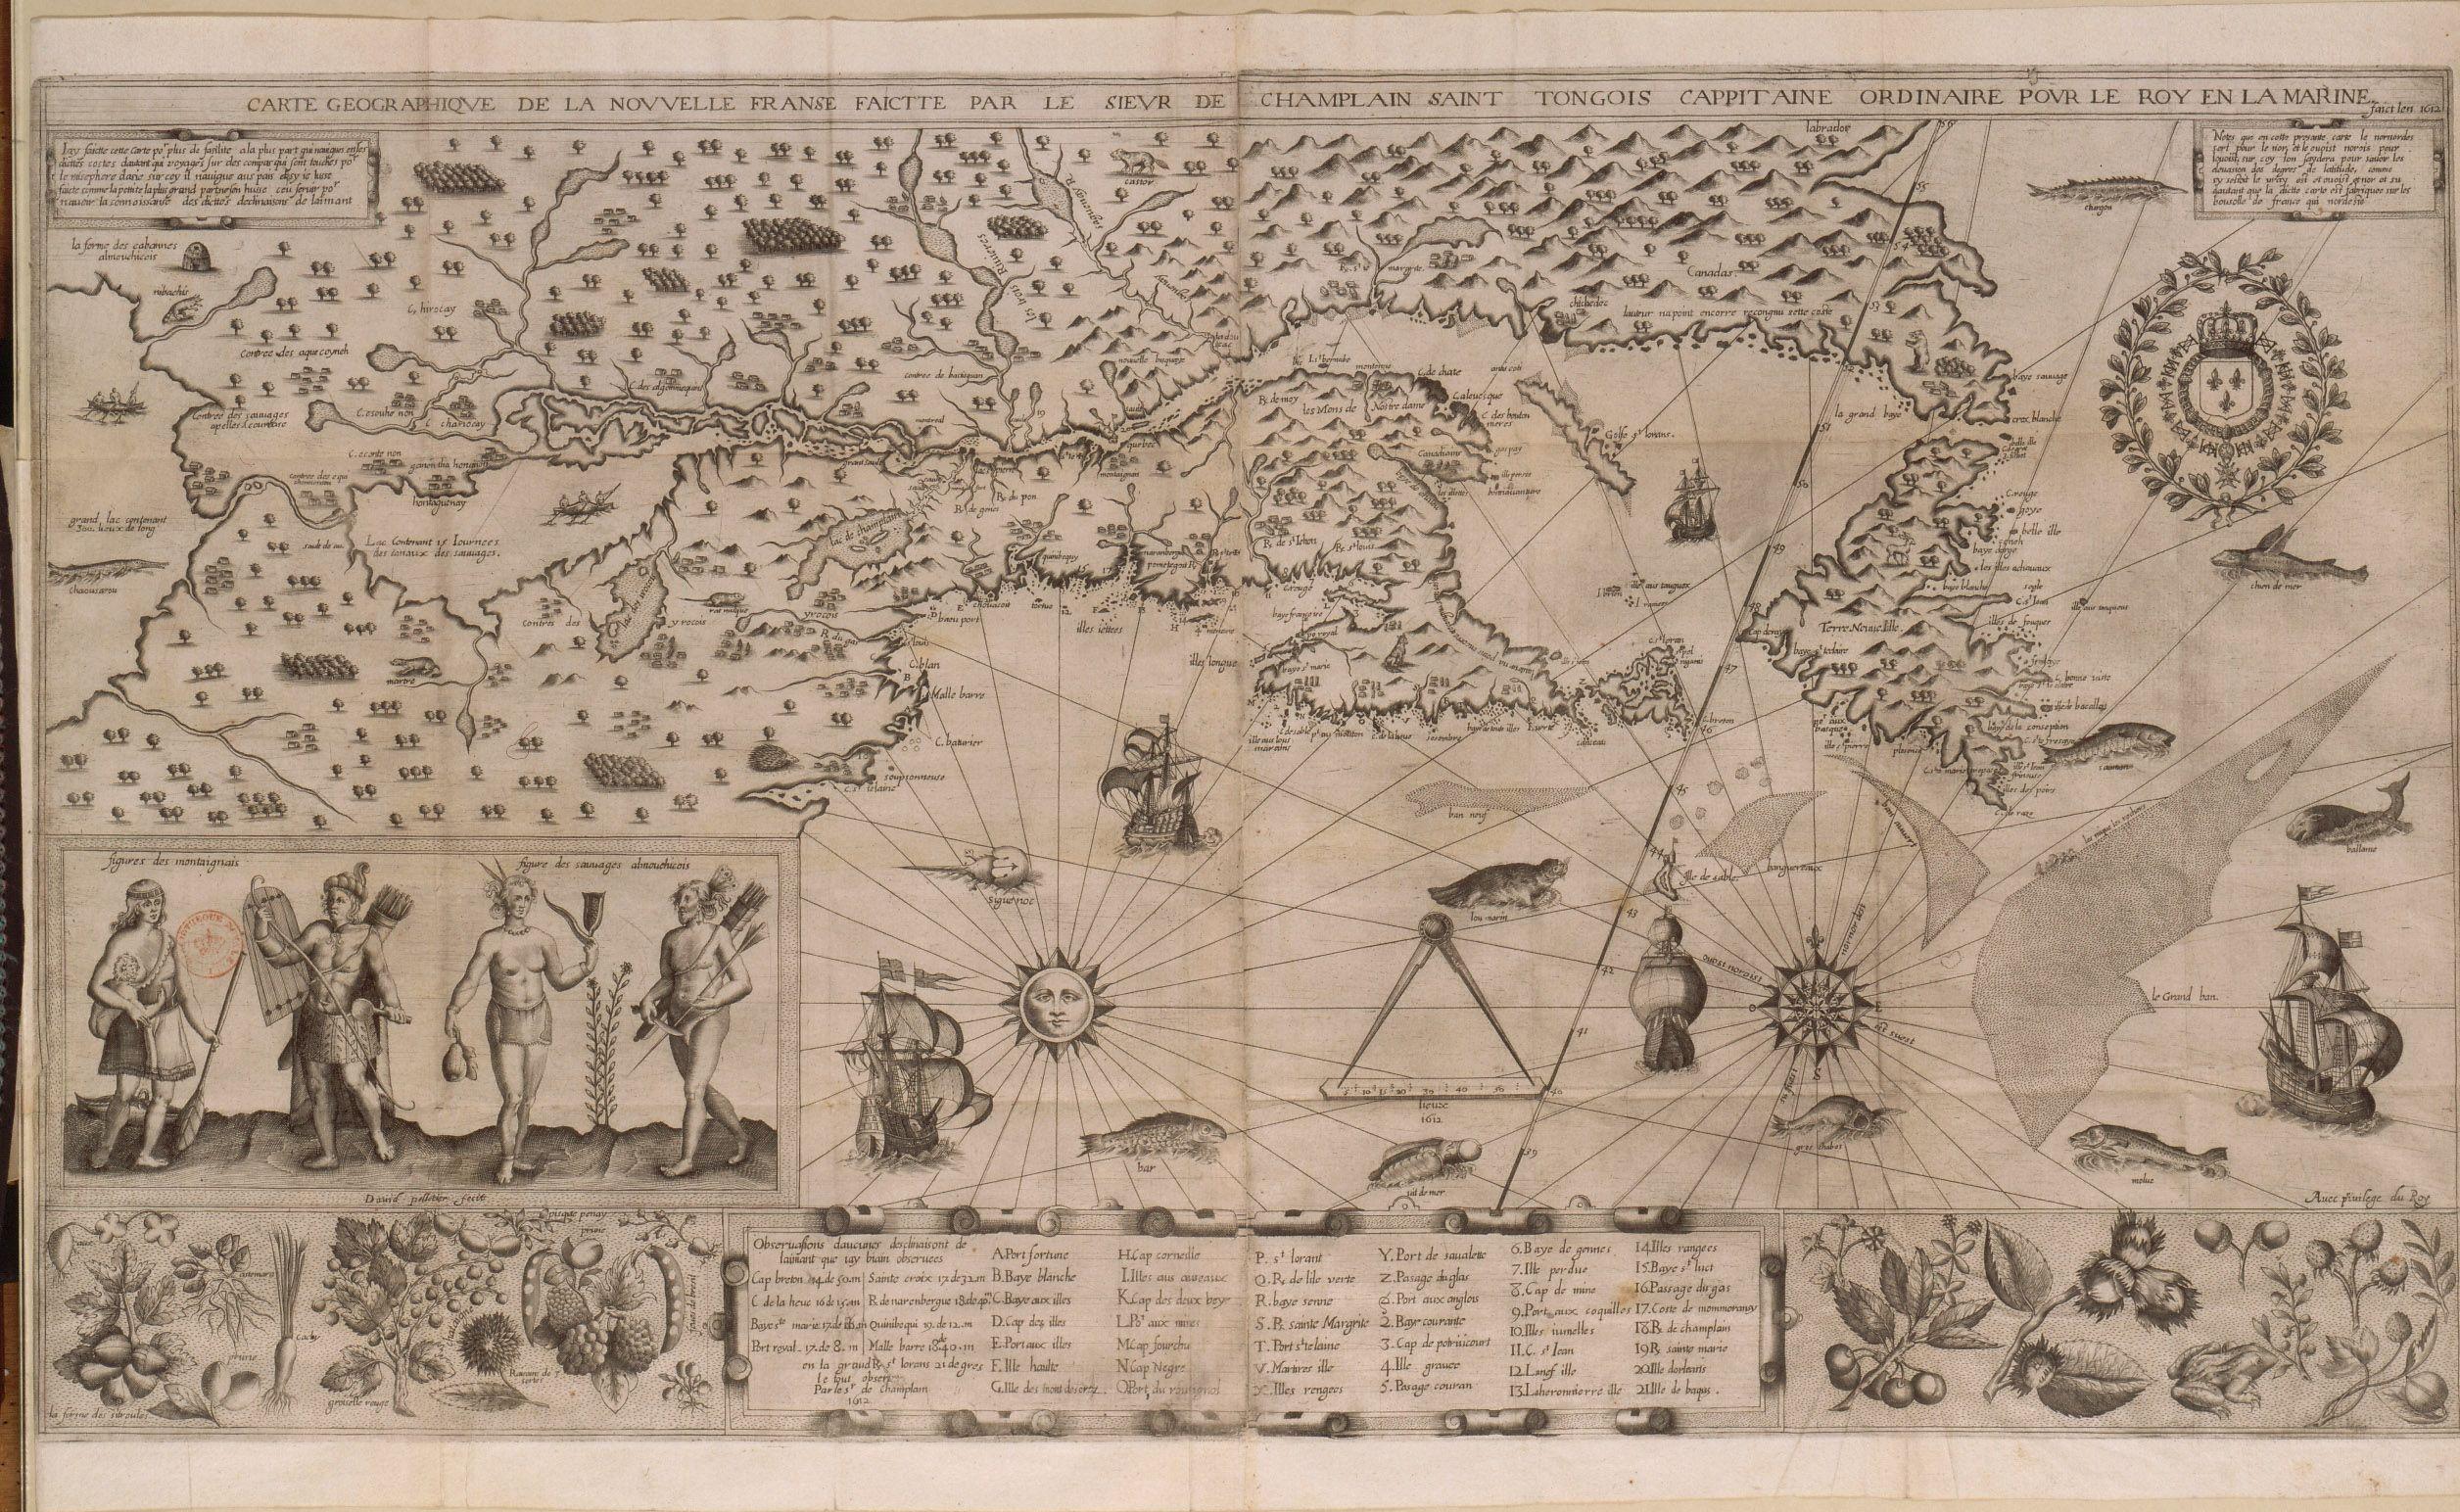
Champlain's 1612 map of New France.
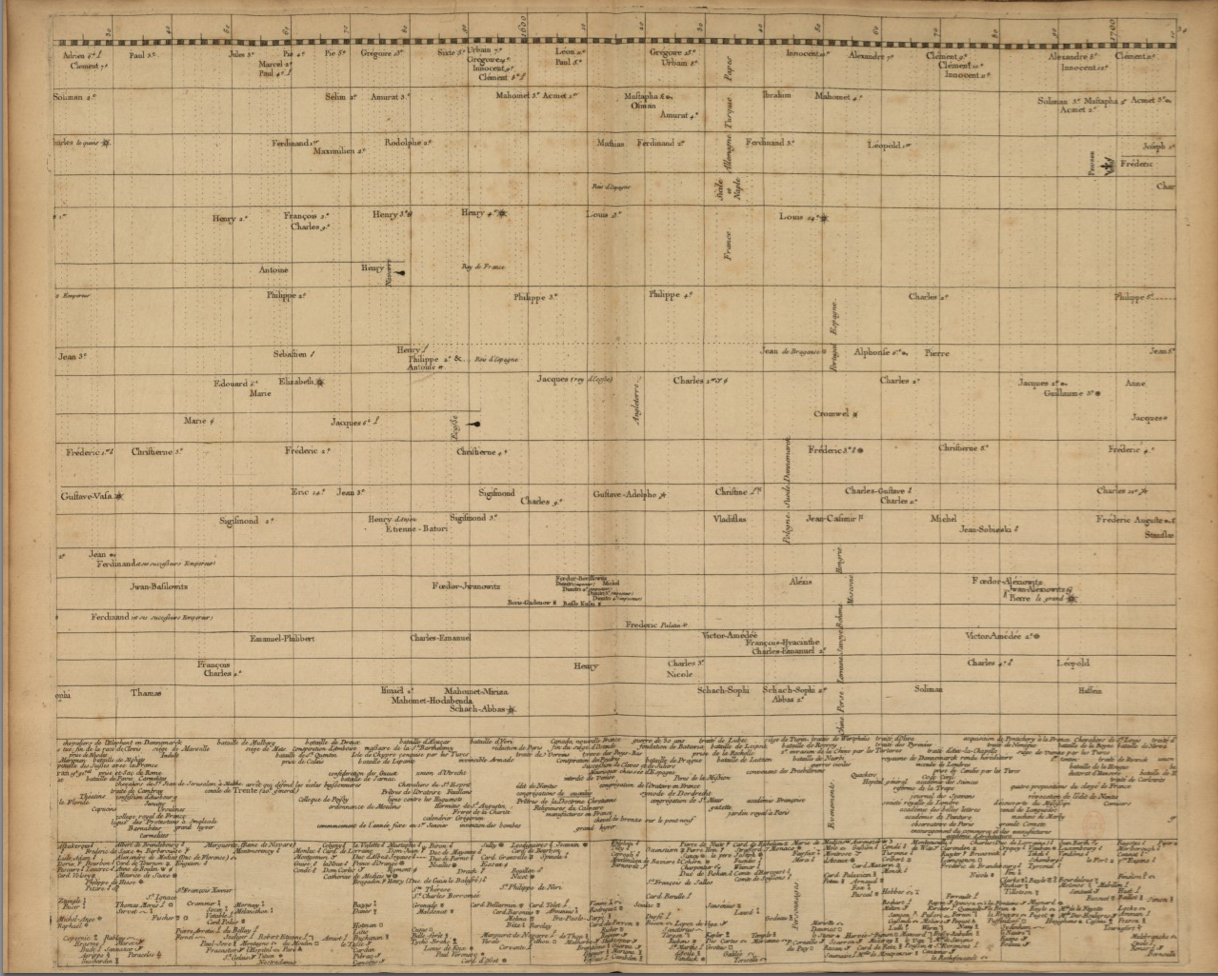
Jacques Barbeu-Dubourg carte chronologique. 1753
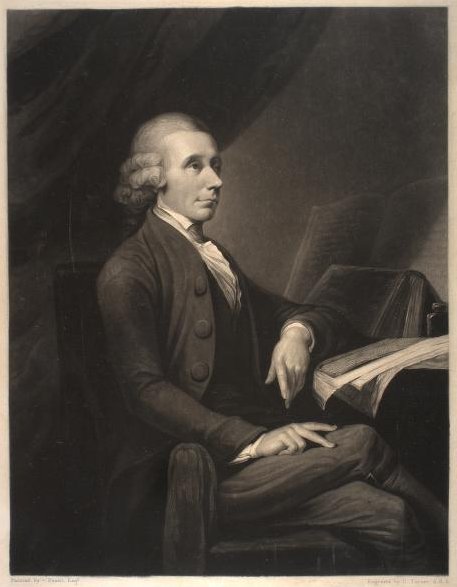
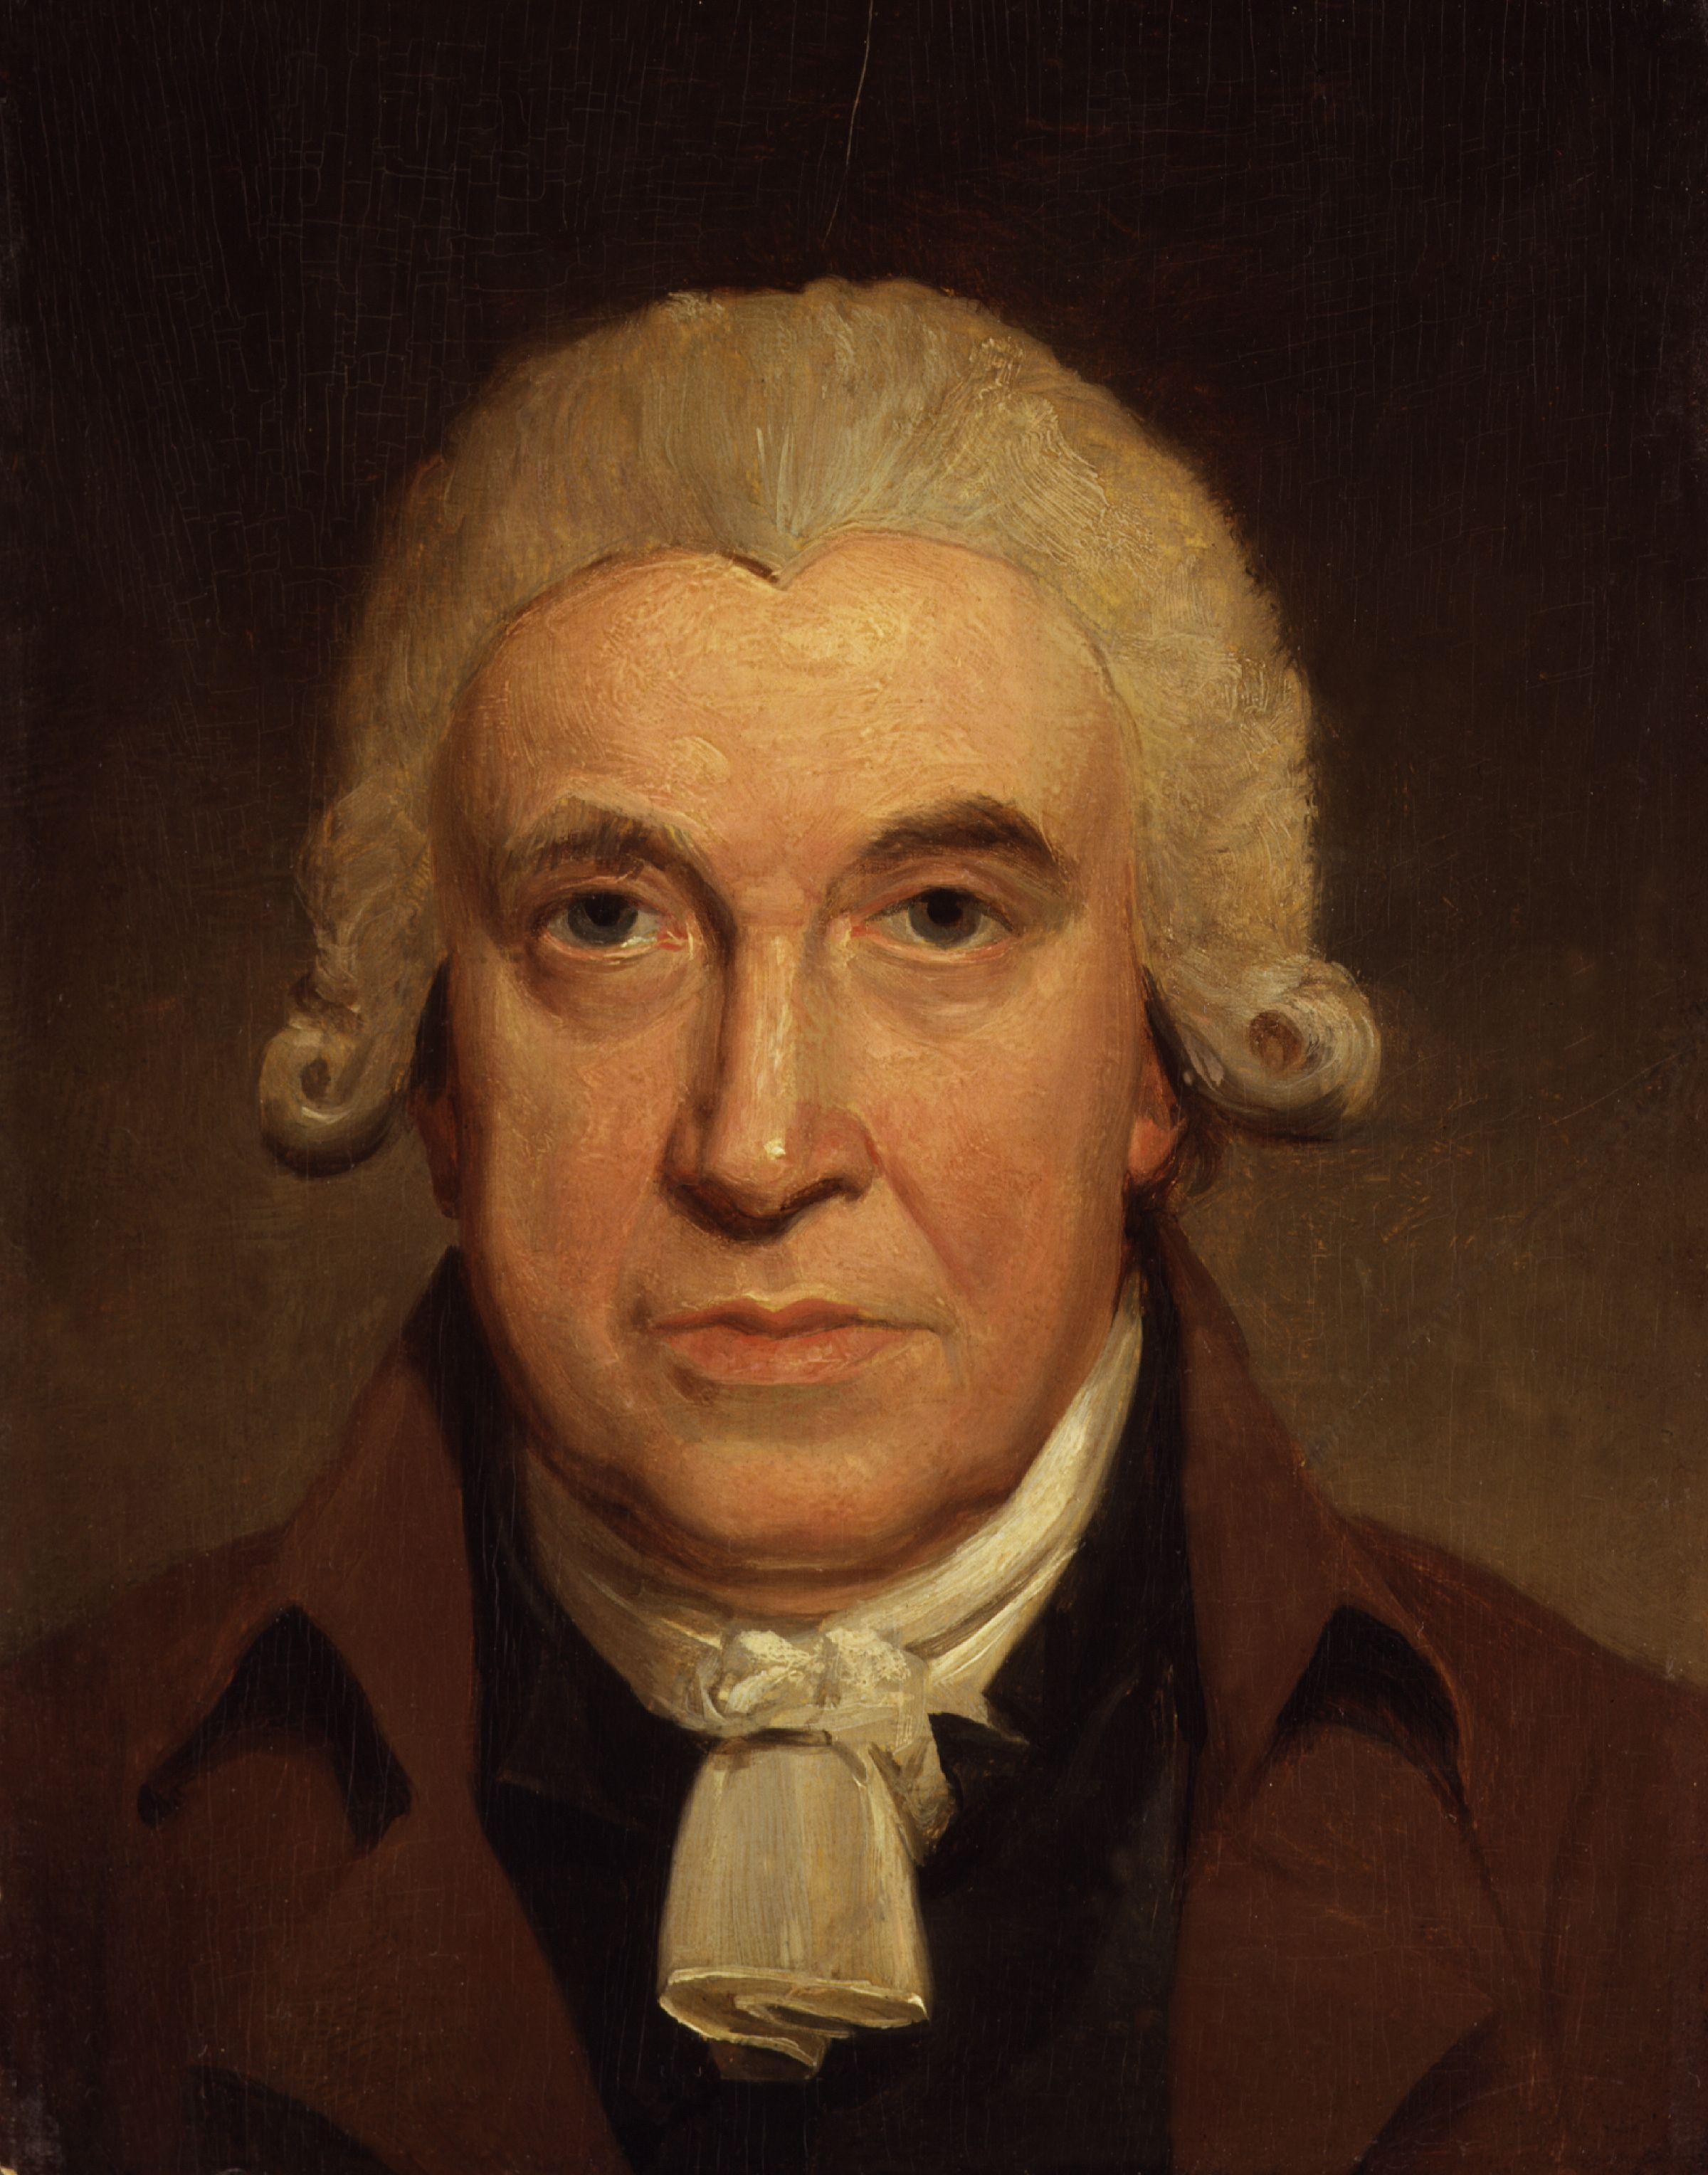
Joseph Priestly (1733-1804)
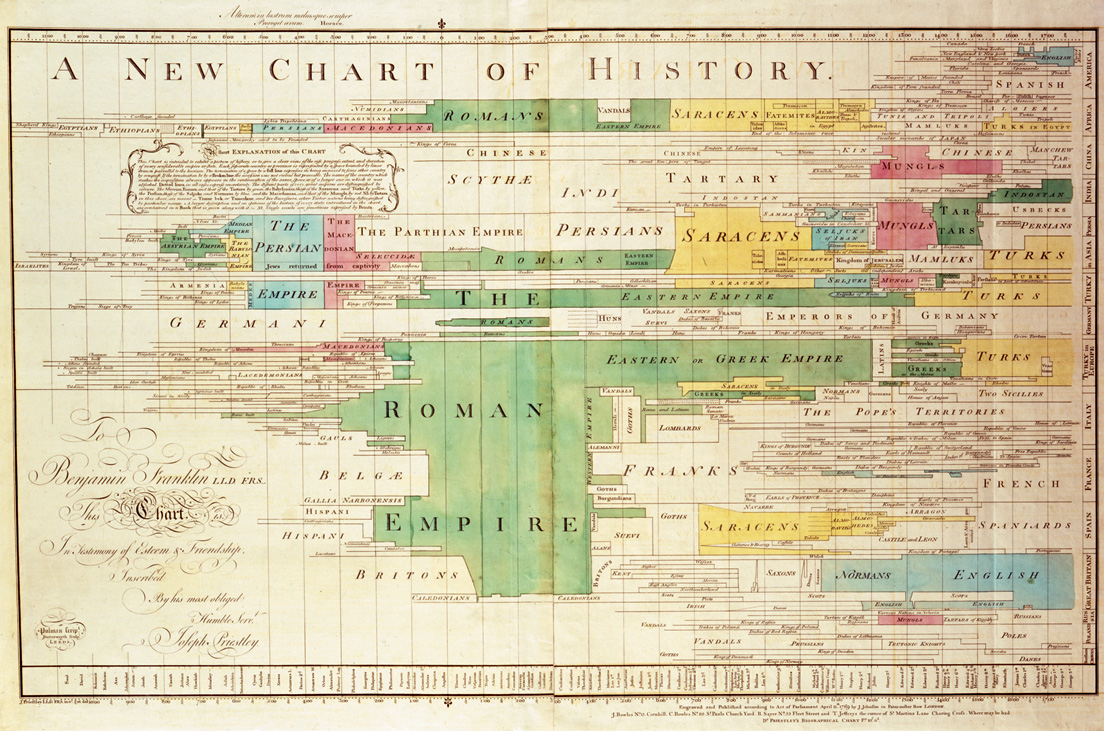
Priestley's historical chart (1769)
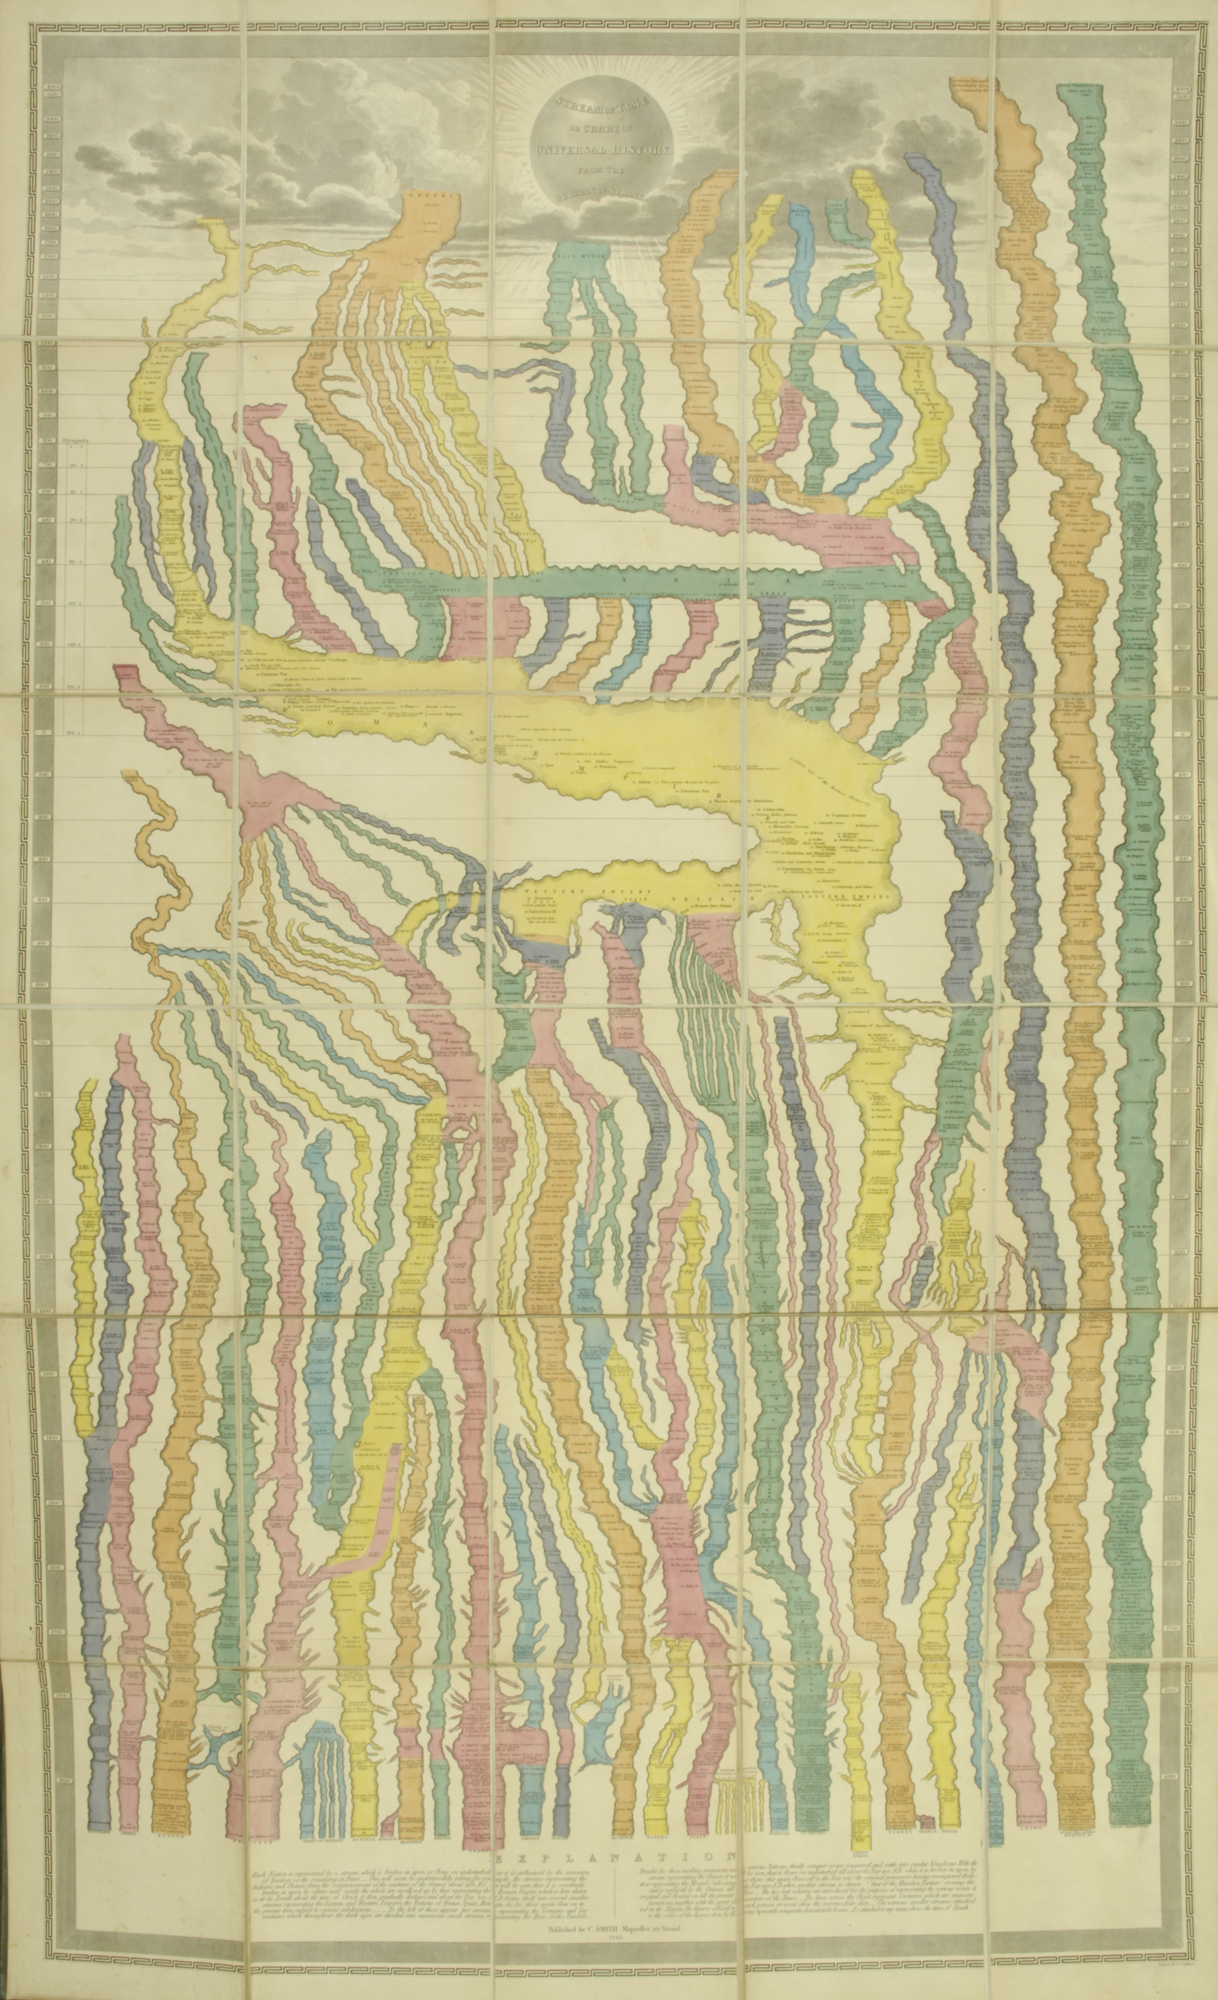
J.H. Colton's Stream of Time, 1842.

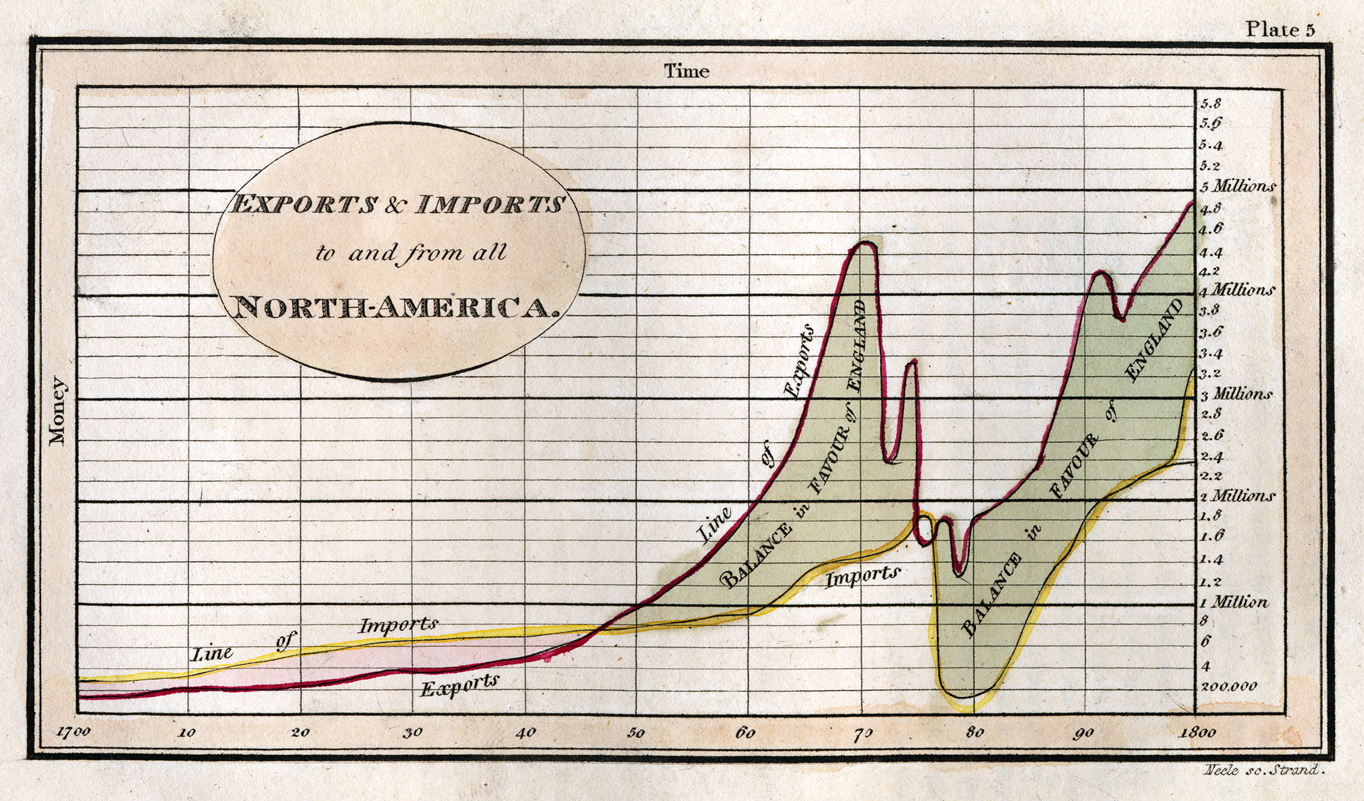
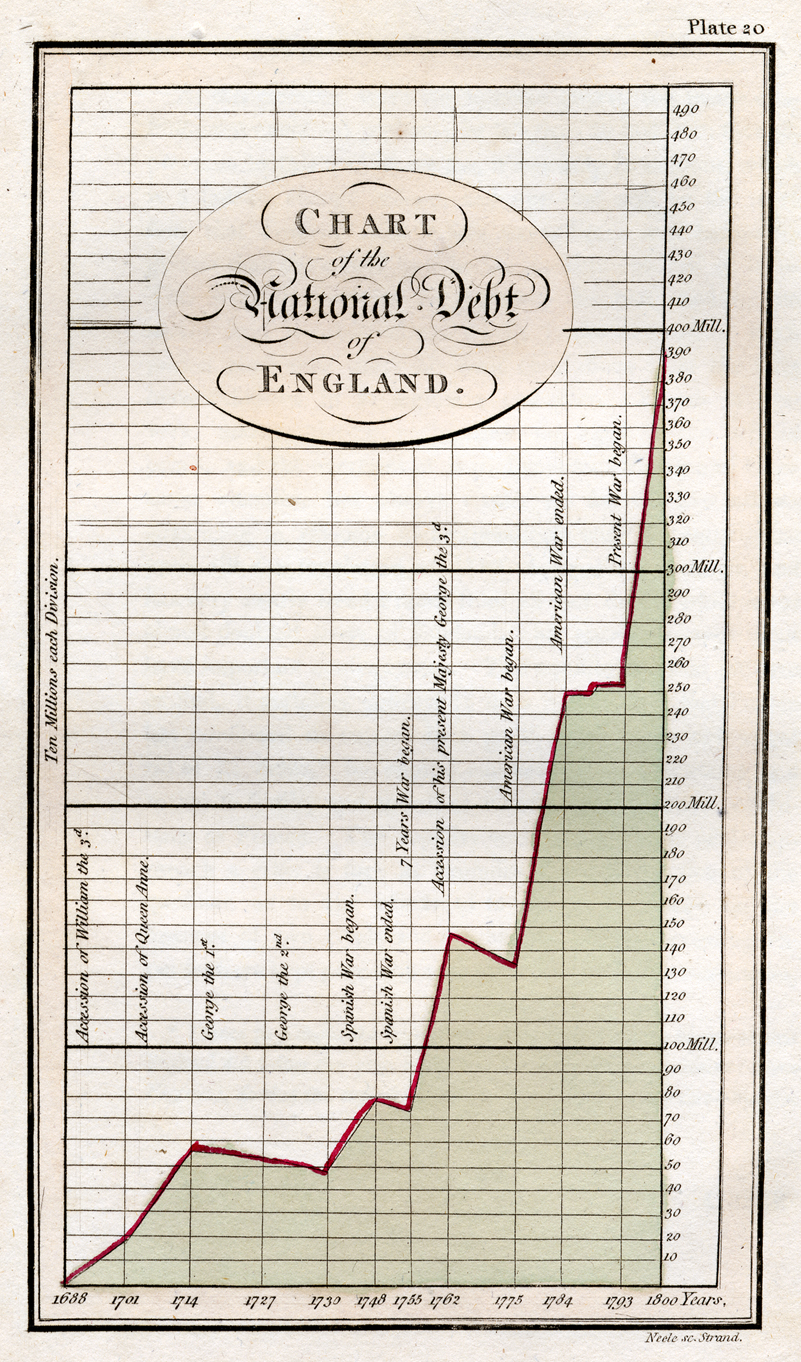
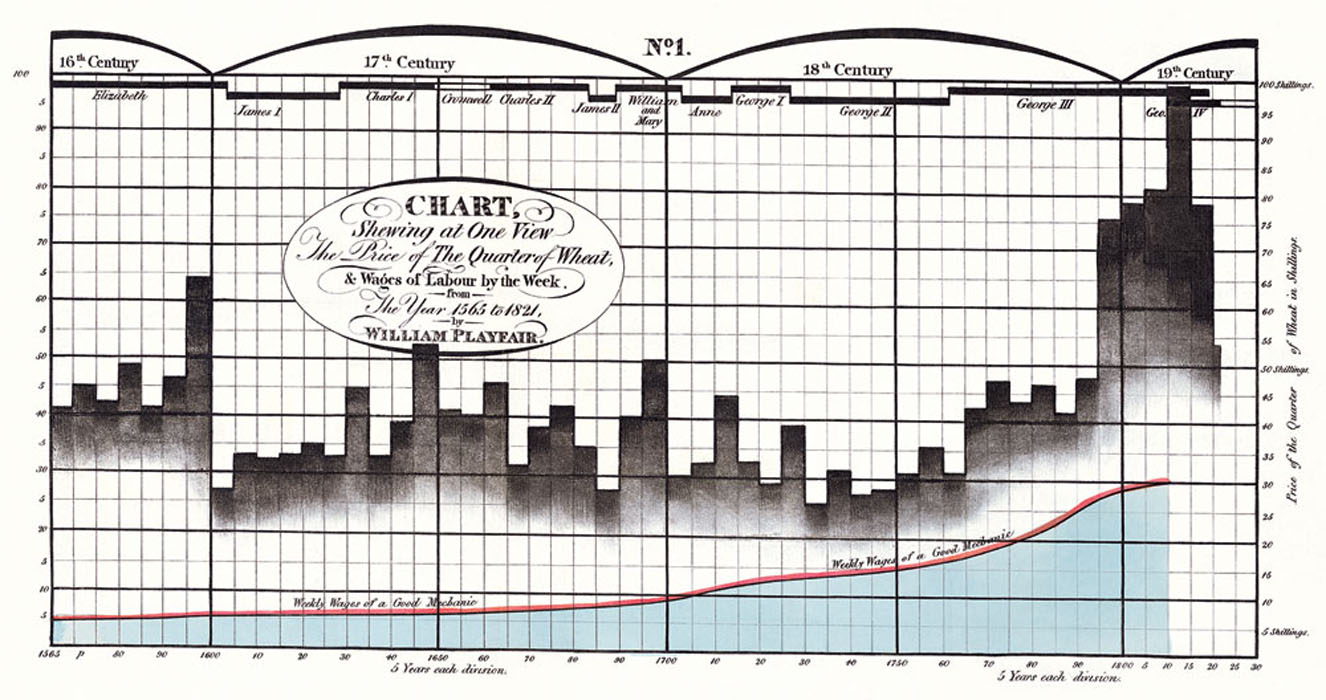
William Playfair?
Not William Playfair


This Chart is different from the others in principle, as it does
not comprehend any portion of time, and it is much inferior in utility to those that do; for though
it gives the extent of the different branches of trade, it does not compare the same branch of
commerce with itself at different periods. . .”
(Playfair, 1786, p. 101, from Tufte, 1983, p. 33).
 Caption: Playfair's Pie and Circle Charts, 1801
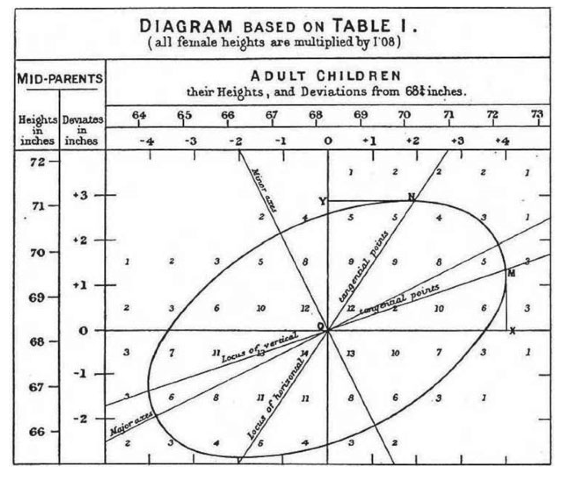
Galton's "scatterplot"
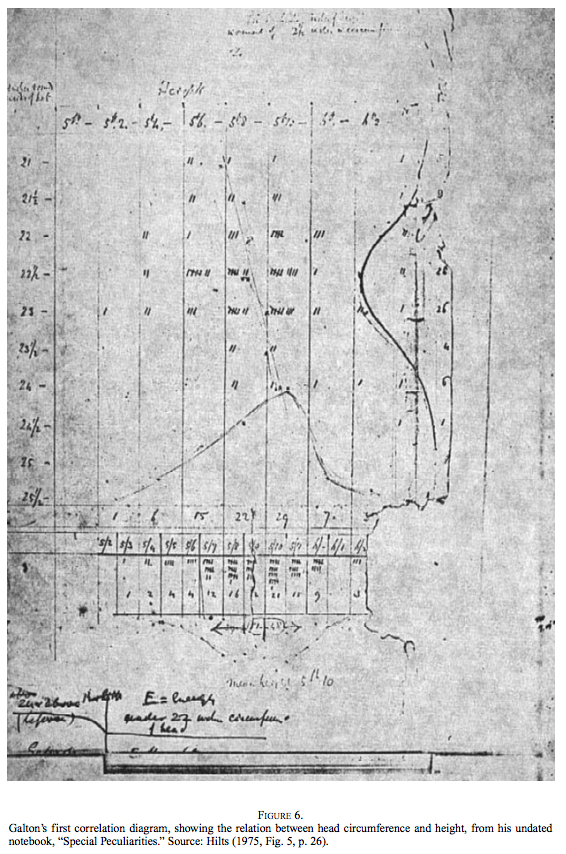 The actual picture of Galton's scatterplot.

Guerry's choropleths, 1820s
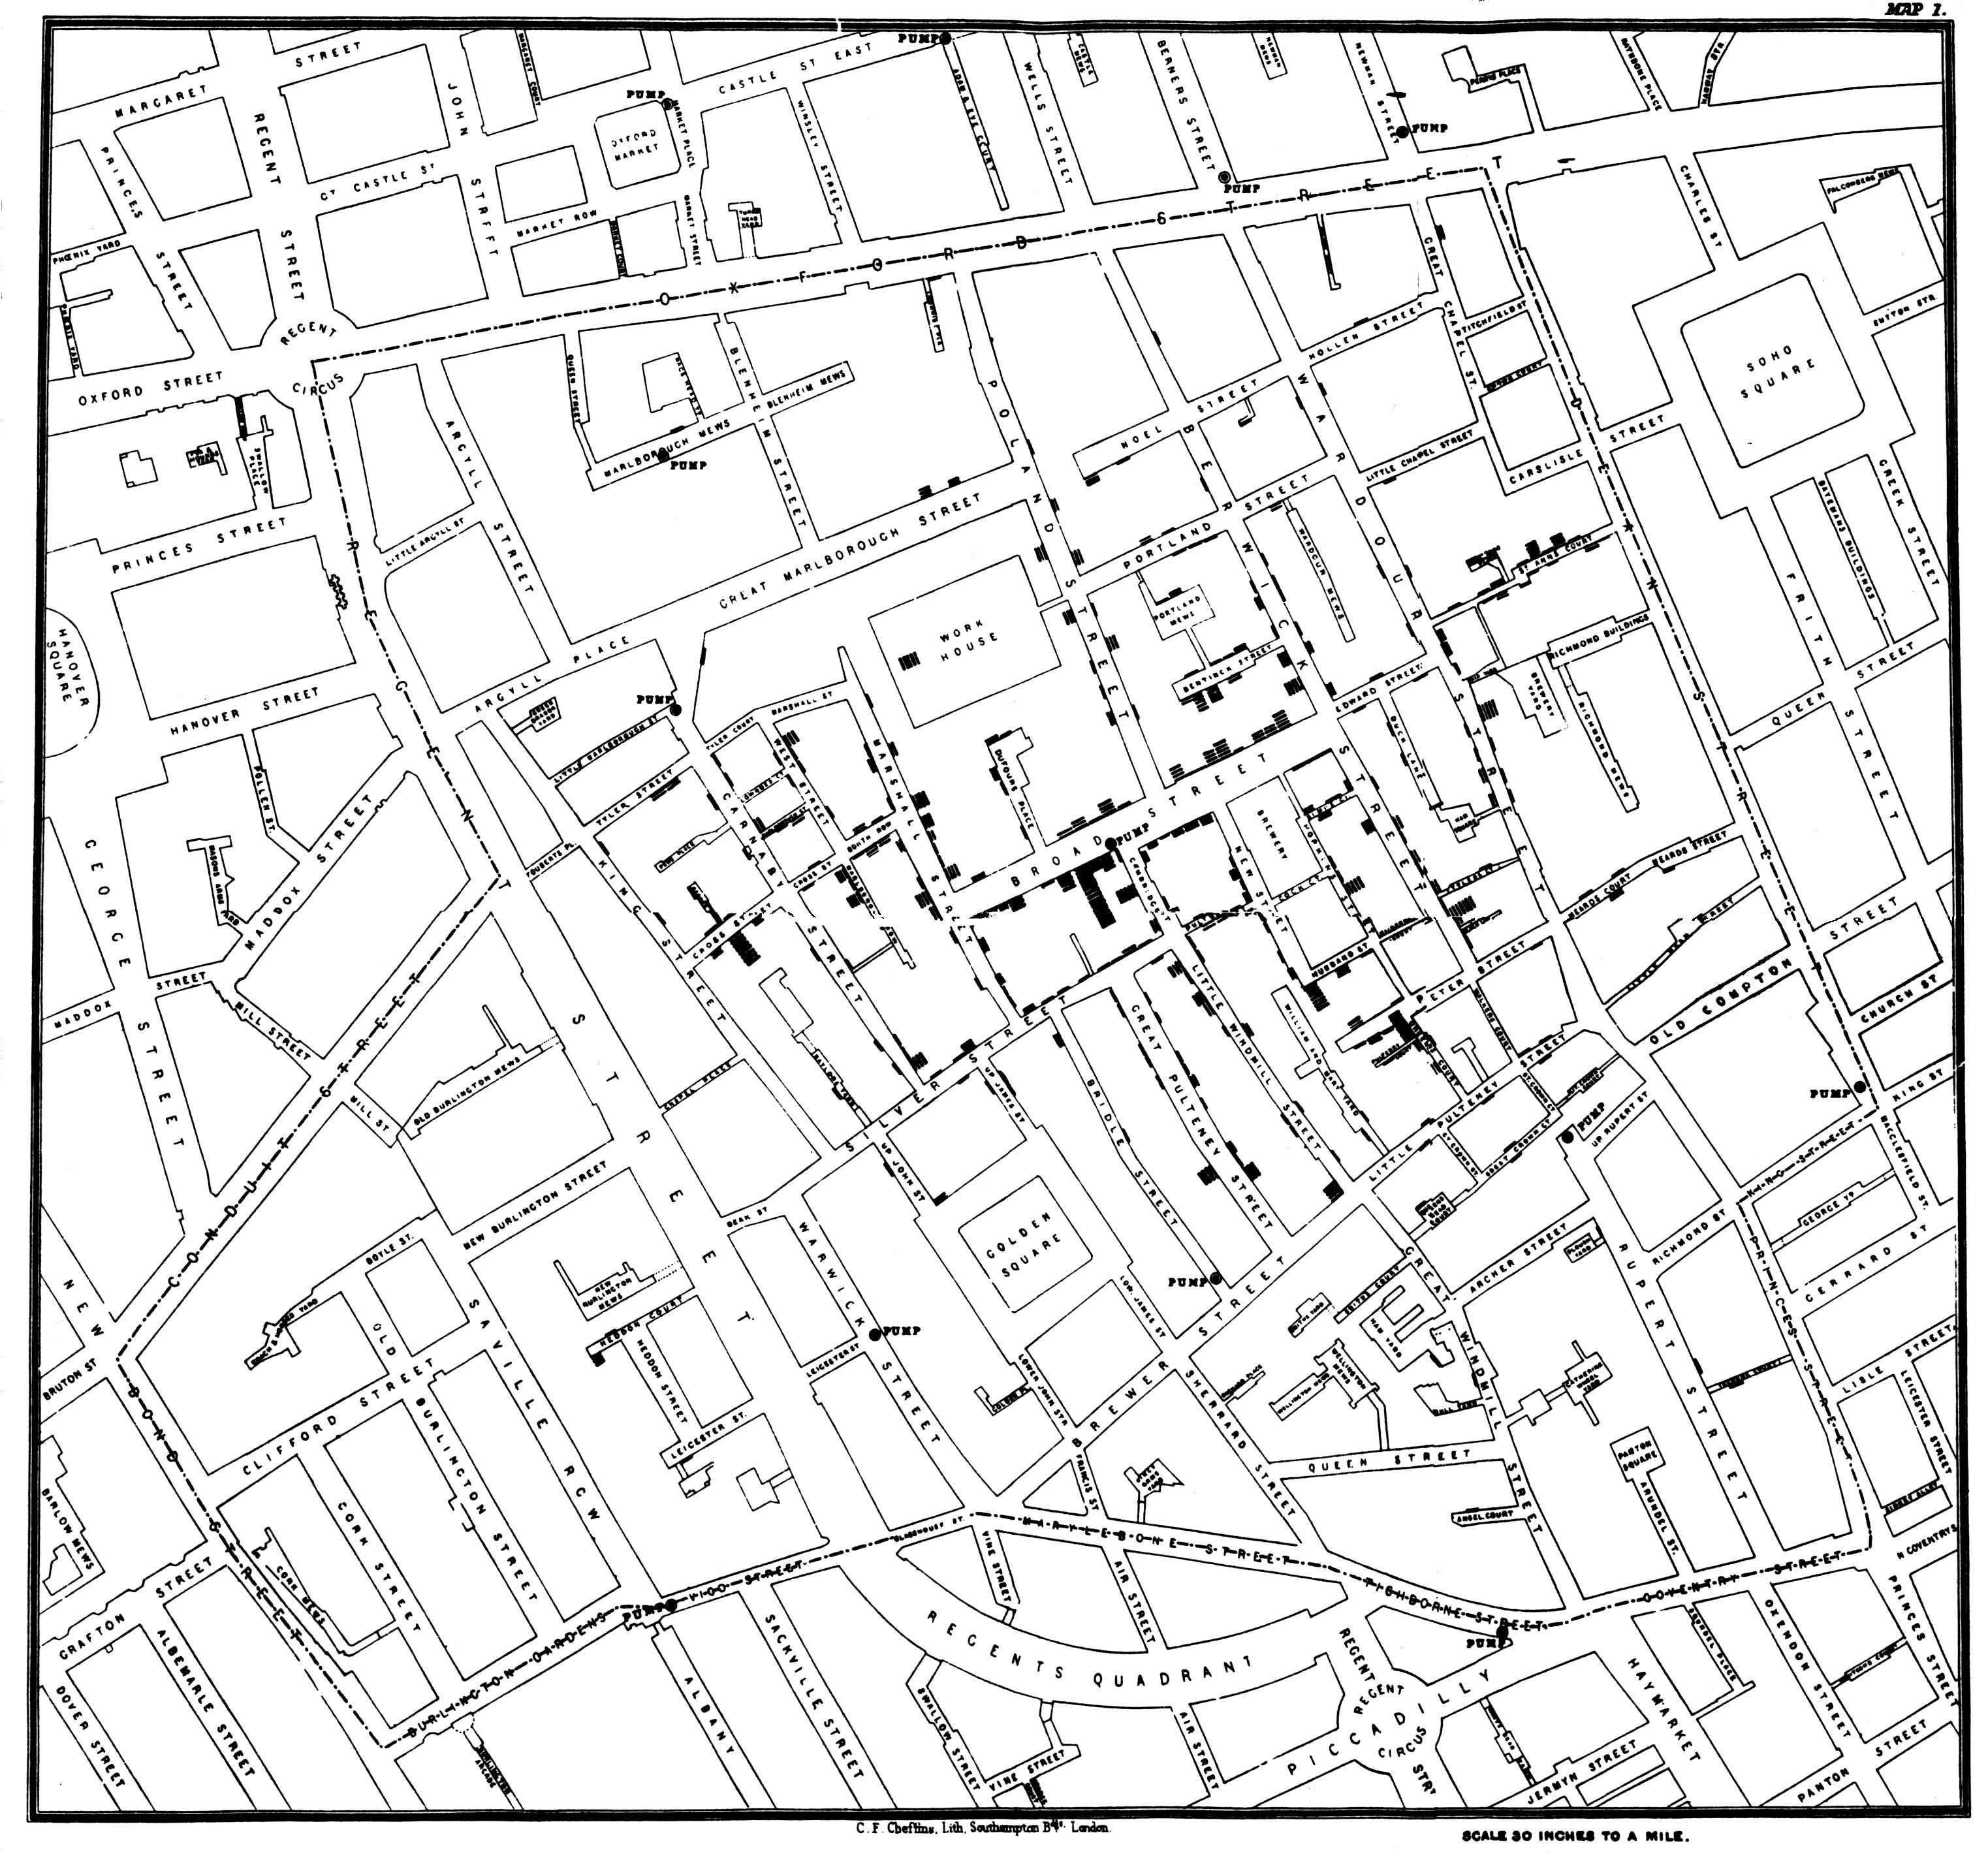 Snow's map of the 1854 cholera epidemic.

Florence Nightingale, 1857
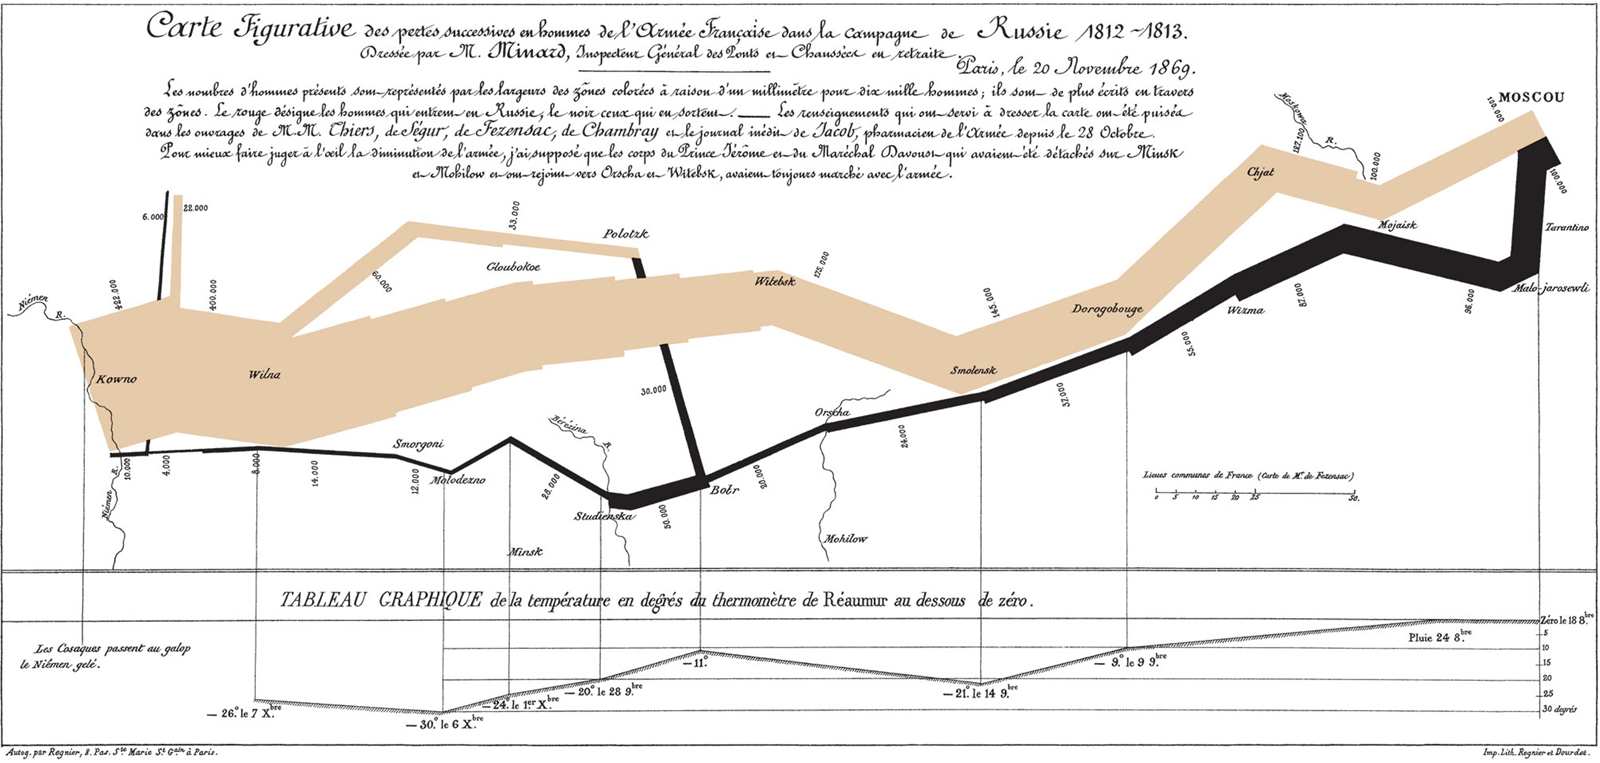
Minard's chart of Napoleon's march on Russia.
A modern interpretation of Minard's map.
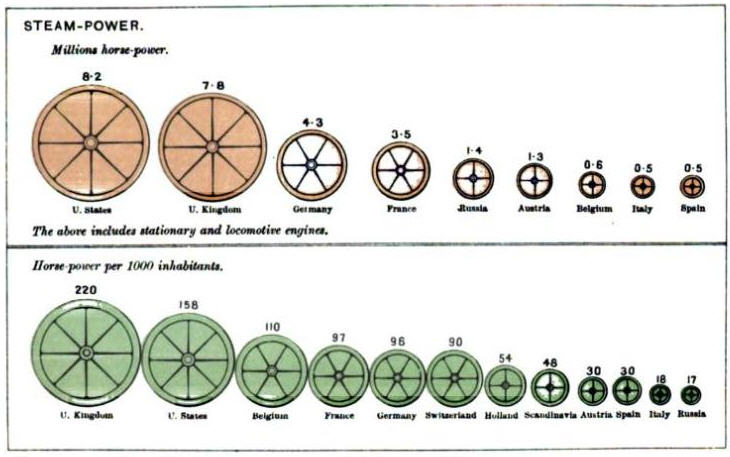
Mulhall's pictogram (1884)