Reconstructing the Map

Benjamin MacDonald Schmidt Assistant Professor of History, Northeastern University Core Faculty, NuLab for Texts, Maps, and Networks

May 2015

Overview

  1. Data is a historical artifact
  2. Statistics is the domain of the state and other bureaucracies
Deconstruction and Reconstruction

Logbooks

Climate metadata, 1789-c.1860

icoads.noaa.gov

Whaling Logbooks

1848 6 1     3723 29038 02 4    10ISABE*_N   1   5                                                           
165 20779701 69 5 0 1                  FFFFFF77AAAAAAAAAAAA     99 0 790044118480601 
3714N 6937W                                                                           NW     51 NW     57 NW   
51                                          201A.STEWART       NEW BEDFORD             WHALING V
OYAGE           2620 199

Matthew Maury's Wind and Current Charts

Re-reading Logbooks

Reconstructed Shipping Times

Deck 701, US Maury Collection (1789-c.1865)

The expansion of whaling

Deck 701, US Maury Collection (1789-c.1865)

Deck 892, US shipping 1980-1997

Logbook Digitization in the 1920s

Wallbrink, H. and F.B. Koek, Data Acquisition And Keypunching Codes For Marine Meteorological Observations At The Royal Netherlands Meteorological Institute, 1854–1968

Digitized logbooks, c. 1930

Wallbrink and Koek

ICOADS Deck 720, German weather data, 1876-1914

ICOADS Deck 735, Soviet Research Vessels

Closeup of Deck 735. Soviet Vessels near the coast of South America.

ICOADS Deck 735, Russian Research Vessel (R/V) Digitisation

German Deep Drifter Data (via ISDM; originally from IfM/Univ. Kiel)

Interactivity

The Census and the Frontier

In a recent bulletin of the Superintendent of the Census for 1890 appear these significant words: "Up to and including 1880 the country had a frontier of settlement, but at present the unsettled area has been so broken into by isolated bodies of settlement that there can hardly be said to be a frontier line. In the discussion of its extent, its westward movement, etc., it can not, therefore, any longer have a place in the census reports." This brief official statement marks the closing of a great historic movement. Up to our own day American history has been in a large degree the history of the colonization of the Great West.

Census Atlases

1790

1800

1810

1820

1830

1840

1850

1860

1870

1880

1890

1870 Census atlas, detail

The maps of the census reports show an uneven advance of the farmer's frontier, with tongues of settlement pushed forward and with indentations of wilderness. In part this is due to Indian resistance, in part to the location of river valleys and passes, in part to the unequal force of the centers of frontier attraction.

Turner, Significance

Raw templates for sending maps to printer, 1900 census (National Archives)

Re-drawing the frontier

1880

1890

Georeferencing and training

Census frontiers (red) vs county boundaries

1890

1900: The frontier line returned

County data, 1920 atlas: National Archives

Charles Paullin Historical Atlas, 1932

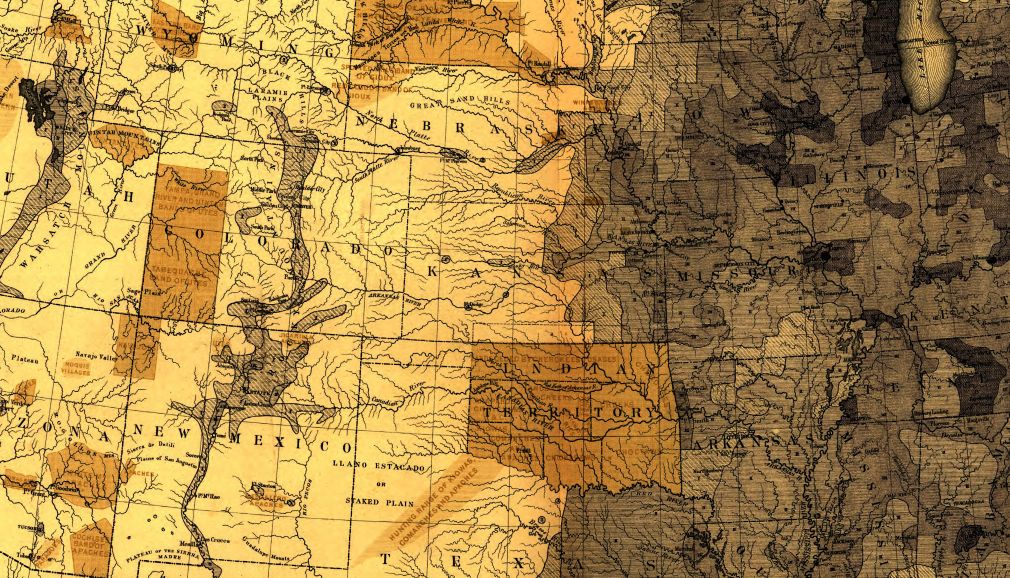
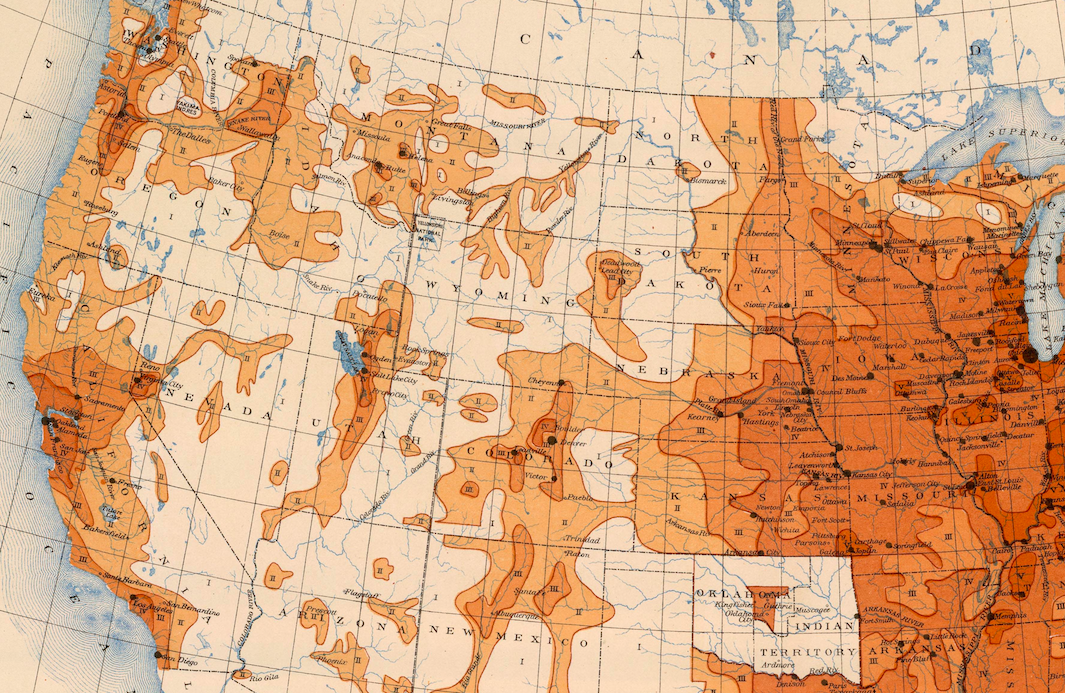
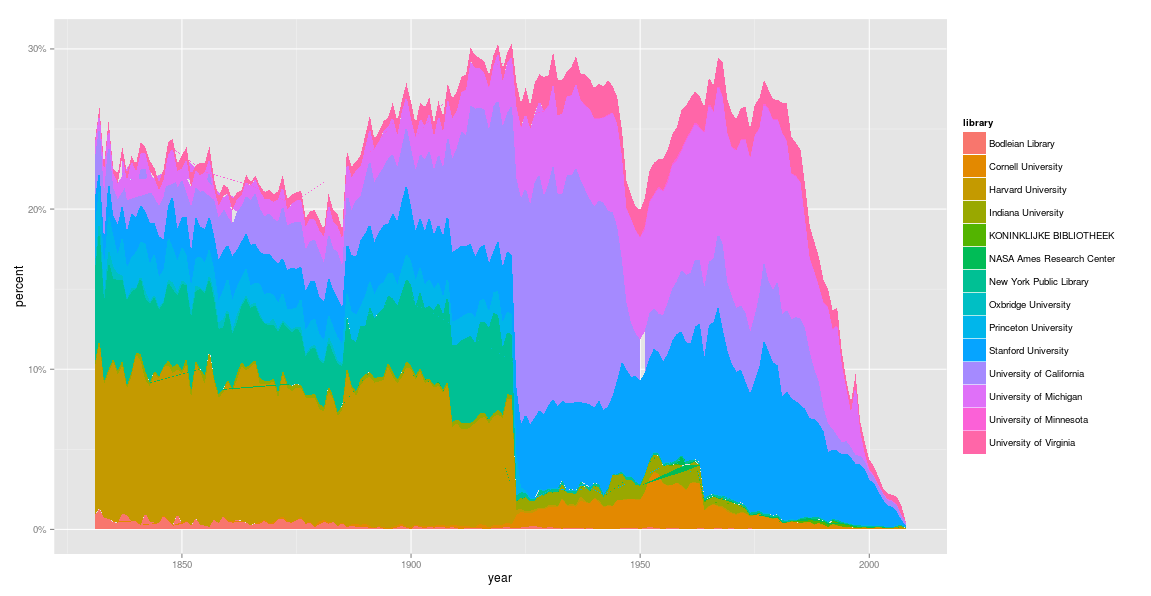
David Rumsey Historical Maps
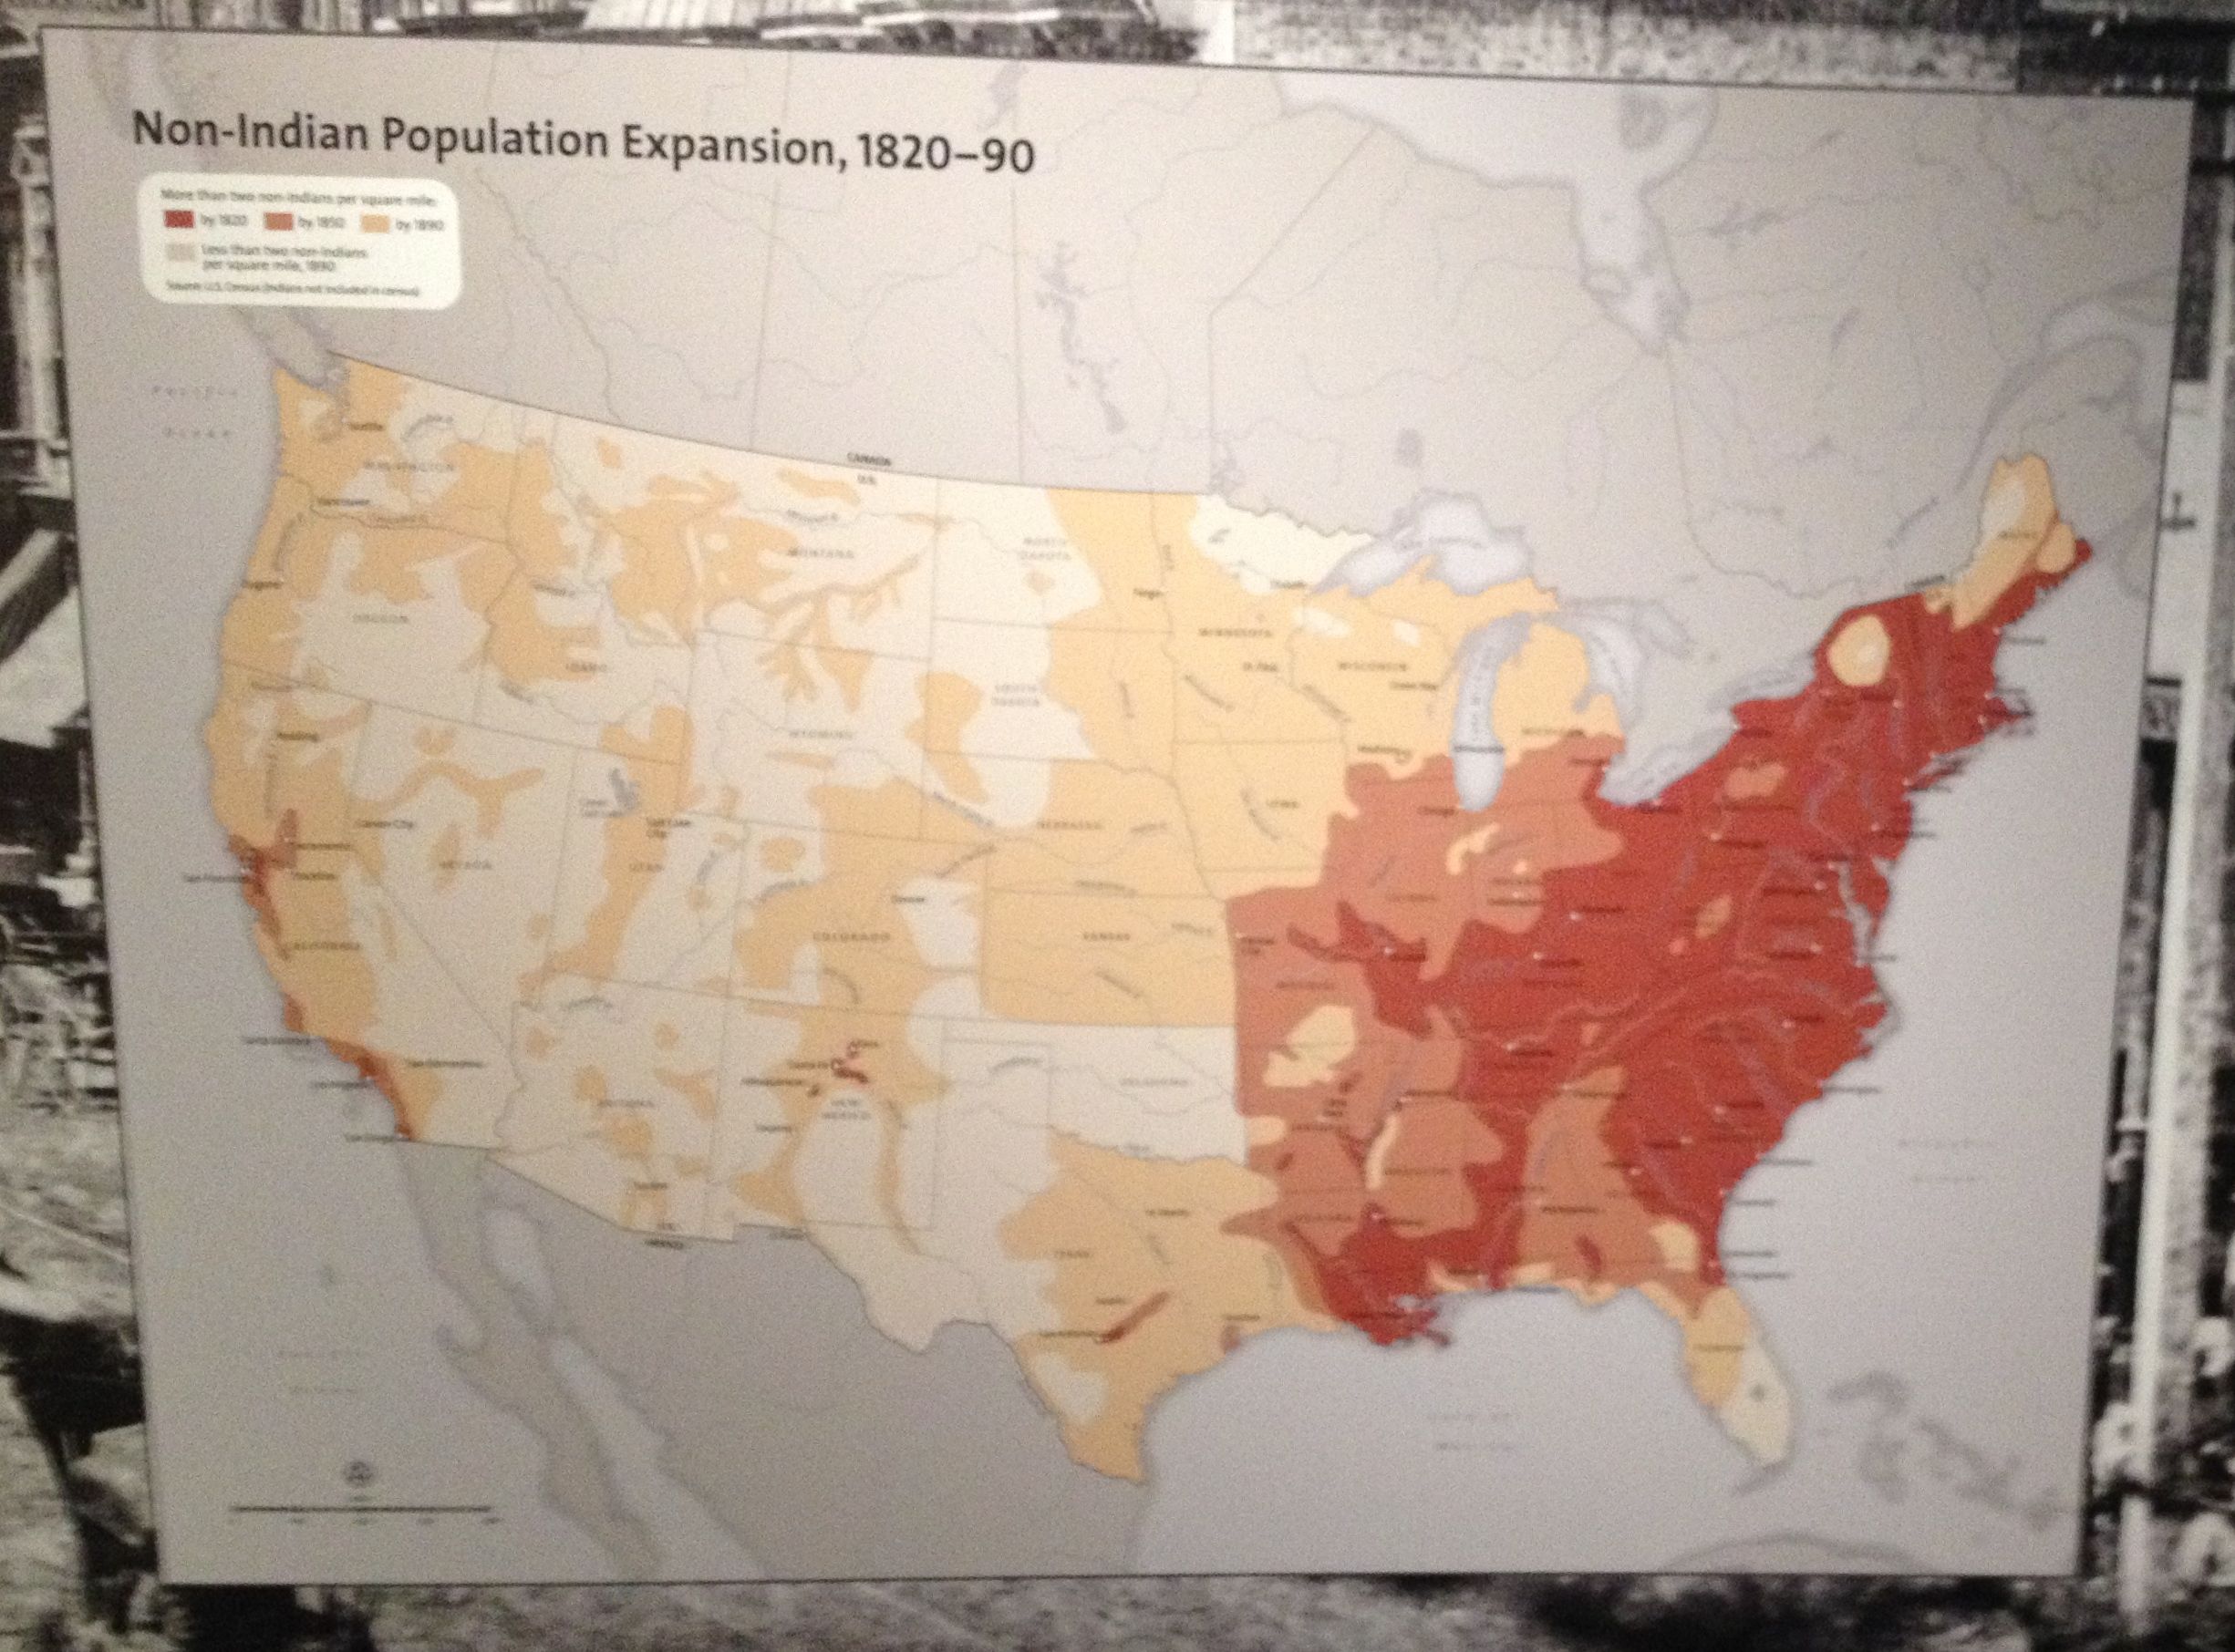
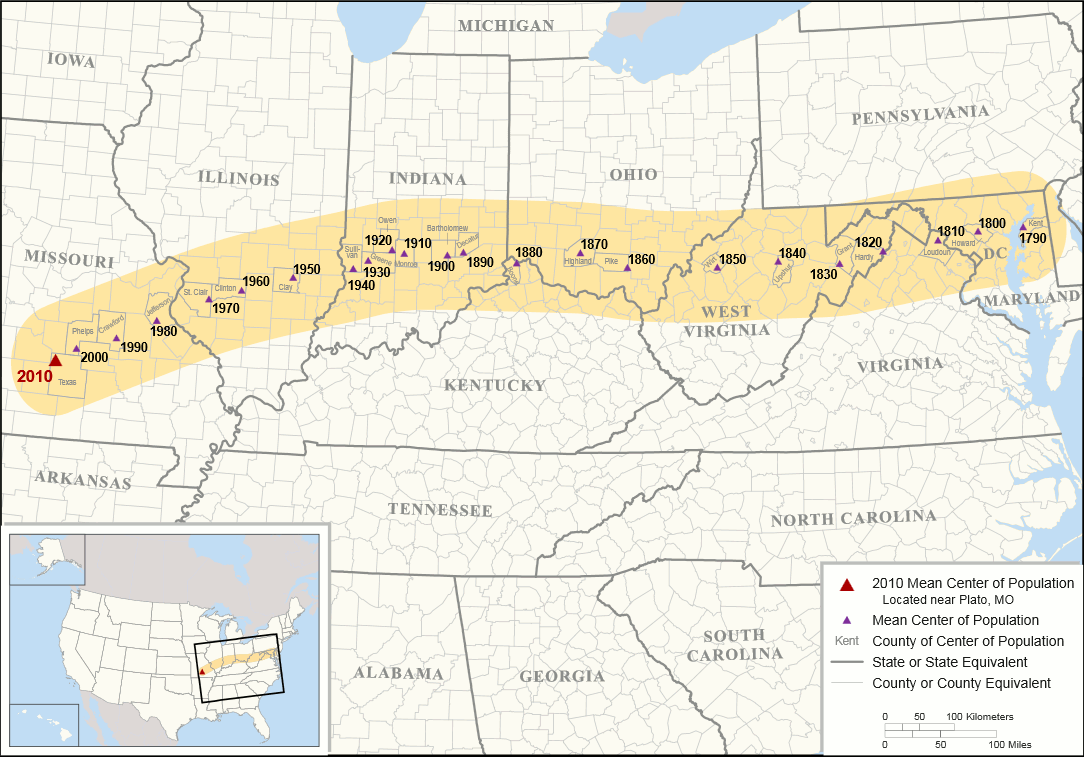
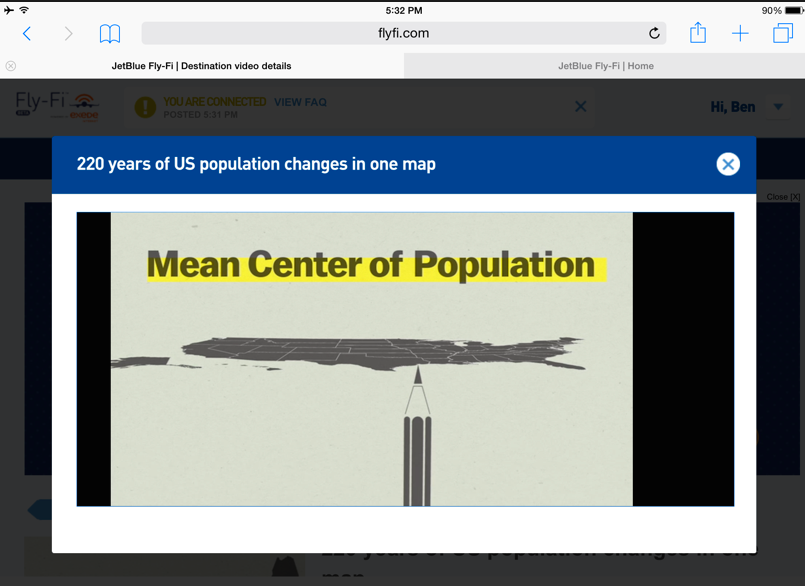
Madison Grant, Passing of the Great Race, 1916

1880

1890 Frontier map, detail

National Museum of the American Indian, 2014

1890:

  1. The Turner Census
  2. The Exclusion Census
  3. The Punchcard Census
  4. The Lost Census.

Constructing authority: The Center of Population

Mean Center of Population, US Census Bureau

Vox Media/Jet Blue

Median vs Mean: US census Bureau vs. Birmingham Bank

Calculating the Center of New Jersey

Center of Population of the Southern States, Population matrix (National Archives)

Calculating centroids from paper

Calculating the center of population

points = counties.data().map(function(d) {
   return [d3.geo.centroid(d),d.properties[value]]
})
var meanLat = d3.sum(points.map(function(a) {
 return a[0][1]*a[1]}))/
 d3.sum(points.map(function(a) {
 return a[1]
}))
var meanLong = d3.sum(points.map(function(a) {
 return a[0][0]*a[1]*
 Math.cos(a[0][1]/180*Math.PI)}))/
 d3.sum(points.map(function(a) {
    return a[1]*Math.cos(a[0][1]/180*Math.PI)
 }))
})

Turner, "Western State Making in the Revolutionary Era:" AHR, Volume 1, Issue 1
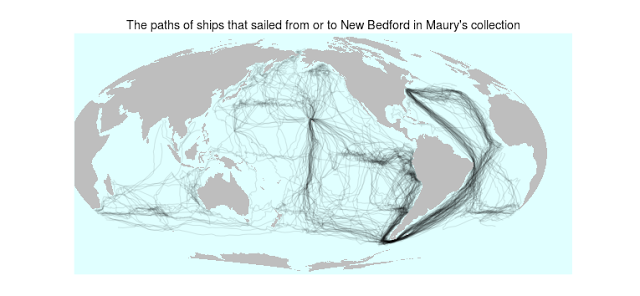
Texts

Thou, Thy, thee

Bibliobazaar

02138

02138

Google's partner libraries shift in 1900, 1922, and later

Classifying Whalers

Ships Out of New Bedford

A training set

A grid as a classification vector

Confusion Matrix as a map

1849 voyages classified

Maury

  1. Filtering
  2. Abstraction
  3. Representation

Matthew Maury

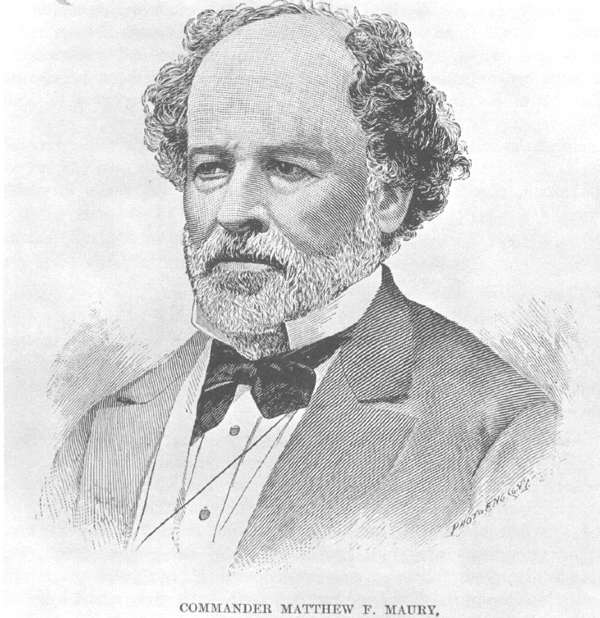
Confederate Navy Engraving 1862, from http://www.history.navy.mil/library/online/maury_mat_bene.htm
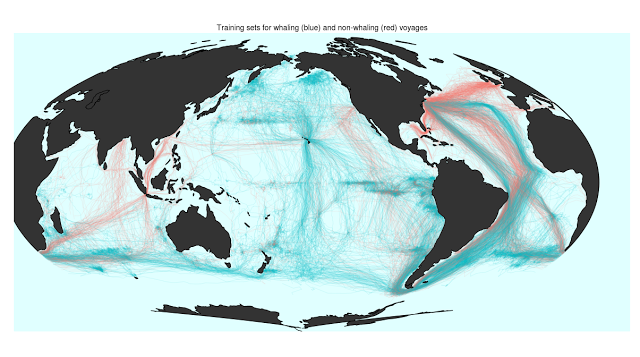
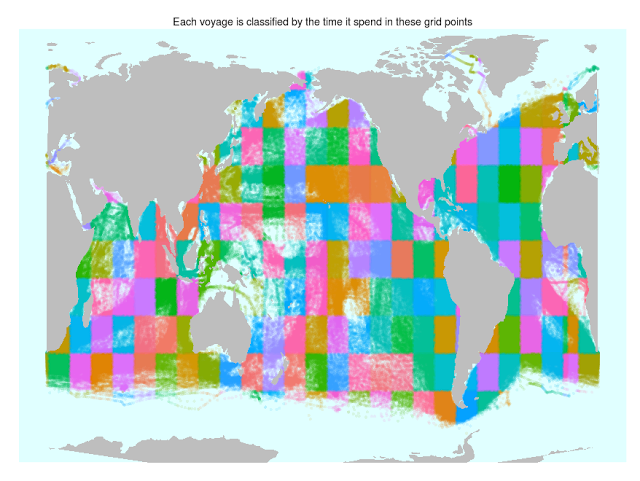
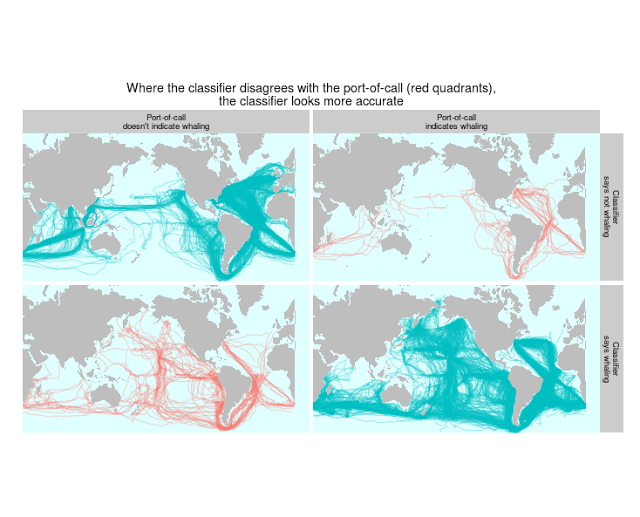
Abstract Logbooks

Harvard University Library