Visualizing & Classifying full-text digital libraries
Benjamin Schmidt
2016-07-29
- How can data visualization help us build exploratory interfaces to huge digital libraries?
- How can we use digital full-text to facilitate discovery and library metadata?
Bookworm
Google Ngrams
- Most users are interested in some subset of books, not everything scanned by Google
- We really don't know what was scanned by Google
Bookworm Project
Institutions
- Northeastern University/Rice University Cultural Observatory
People
- Erez Lieberman Aiden
Neva Cherniavsky, Martin Camacho, Matt Nicklay, Billy Janitsch, JB Michel, Muhammad Shamim.
HathiTrust grant Partners
Acknowledgements
Funders
- Digital Public Library of America
- Harvard Cultural Observatory
- National Endowment for the Humanities
Partners
- Hathi Trust Research Center

- github.com/Bookworm-project
benschmidt.org/slides/NYPL
Some Bookworm instances at Northeastern and Rice:
- 1 million books (Open Library/Internet Archive):
benschmidt.org/OL
- 6 million science (arxiv) articles:
bookworm.culturomics.org/arxiv
- 80,000 Movies and television:
movies.benschmidt.org
- 6 Million Historical Newspaper pages: benschmidt.org/ChronAm
- 14 million teaching evaluations: benschmidt.org/profGender
Yale University: full run of Vogue Magazine

Medical Heritage Library (80,000 medical books, and an increasing number of journals.)
http://mhlbookworm.ngrok.io/ 
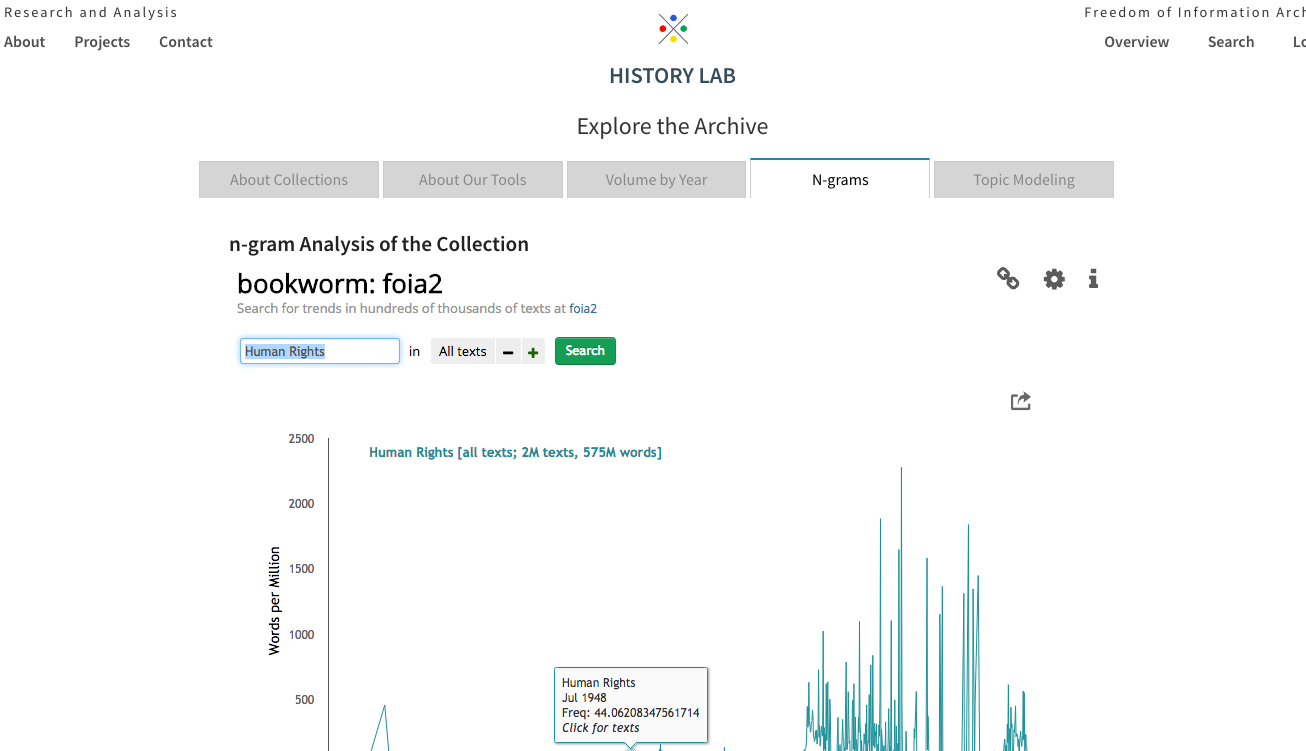
Columbia History Lab
http://www.history-lab.org/about-collections
US State Department

Uses of bicycle, by week, in newspapers
{
"database": "ChronAm",
"plotType": "heatmap",
"search_limits": {
    "publish_year": {
        "$gte": 1860
    },
    "word": ["bicycle"]
},
"aesthetic": {
    "x": "publish_year",
    "y": "publish_week_year",
    "color": "WordsPerMillion"
} }Publication places over time of all the public domain volumes in Hathi Trust
{
"database": "hathipd",
"plotType": "map",
"method": "return_json",
"search_limits": {
    "date_year": {
        "$gte": 1800,
        "$lte": 1922
    }
},
"projection": "albers",
"aesthetic": {
    "time": "date_year",
    "point": "publication_place_geo",
    "size": "TextCount"
}
}Newspaper flu coverage, 1917-1919, by day
{"database": "ChronAm",
"plotType": "map",
"method": "return_json",
"search_limits": {"word":["flu","influenza","pneumonia"],
           "publish_year":{"$lte":1920,"$gte":1918}},
"smoothingSpan":25,
"aesthetic": {
    "time":"publish_day",
  "point": "placeOfPublication_geo",
"size": "TextPercent"}}benschmidt.org/profGender
Embedding texts
Why embed?
- Vectorized documents are a necessary input to algorithms.
- For Finding similar books
- For correcting faulty metadata
- More important now that metadata is being used as the only discovery method for books.
There are too many words.
What's the best way to reduce dimensionality?
- Principal Components Analysis on the Term-Document matrix
- Latent Semantic Indexing
- Topic Modeling
- Locality Sensitive Hashing (Semantic Hashing, etc.)
Reasons not to use the best methods.
- Computationally intractable: full matrix is trillions of rows, sparse matrix is billions.
- Difficult to distribute; users at home can't embed documents in your space.
- Any embedded space is optimal only for the text collection it was trained on.
Stable random projection (SRP) Process
- Start with word frequencies.
- Perform a log-transformation on the frequencies.
- Choose an output dimensionality
- Randomly project those frequencies into a lower dimensional space (using SHA-1 hashes) to make the process reproducible.
Neighbor searches for full-text
Classifying subjects
Why classify automatically?
- Make discovery easier on unlabelled collections.
- Identify mistakes in metadata.
- Better understand biases and prejudices of standard knowledge organization.
The Library of Congress Classification
Organization of cataloging at the Library of Congress, 1909
Organization of cataloging at the Library of Congress, 1909
Success by language
{
"database": "hathipd",
"plotType": "barchart",
"method": "return_json",
"search_limits": {
    "languages__id": {"$lte": 10},
    "LCC_guess_is_correct": ["True"]
},
"compare_limits": {
    "languages__id": {"$lte": 10 },
    "LCC_guess_is_correct": ["False", "True"]
},
"aesthetic": {
    "x": "TextPercent",
    "y": "languages"
}
}Error by subclass
{
"database": "hathipd",
"plotType": "barchart",
"method": "return_json",
"search_limits": {
    "LCC_guess_is_correct": ["False"]
},
"compare_limits": {
    "LCC_guess_is_correct": ["False", "True"]
},
"aesthetic": {
    "x": "TextPercent",
    "y": "lc_classes"
}
}Classifying dates
Classifying dates
Representing time as a ratchet;
To encode 1985 in the range 1980-1990: [0,0,0,0,0,1,1,1,1,1]
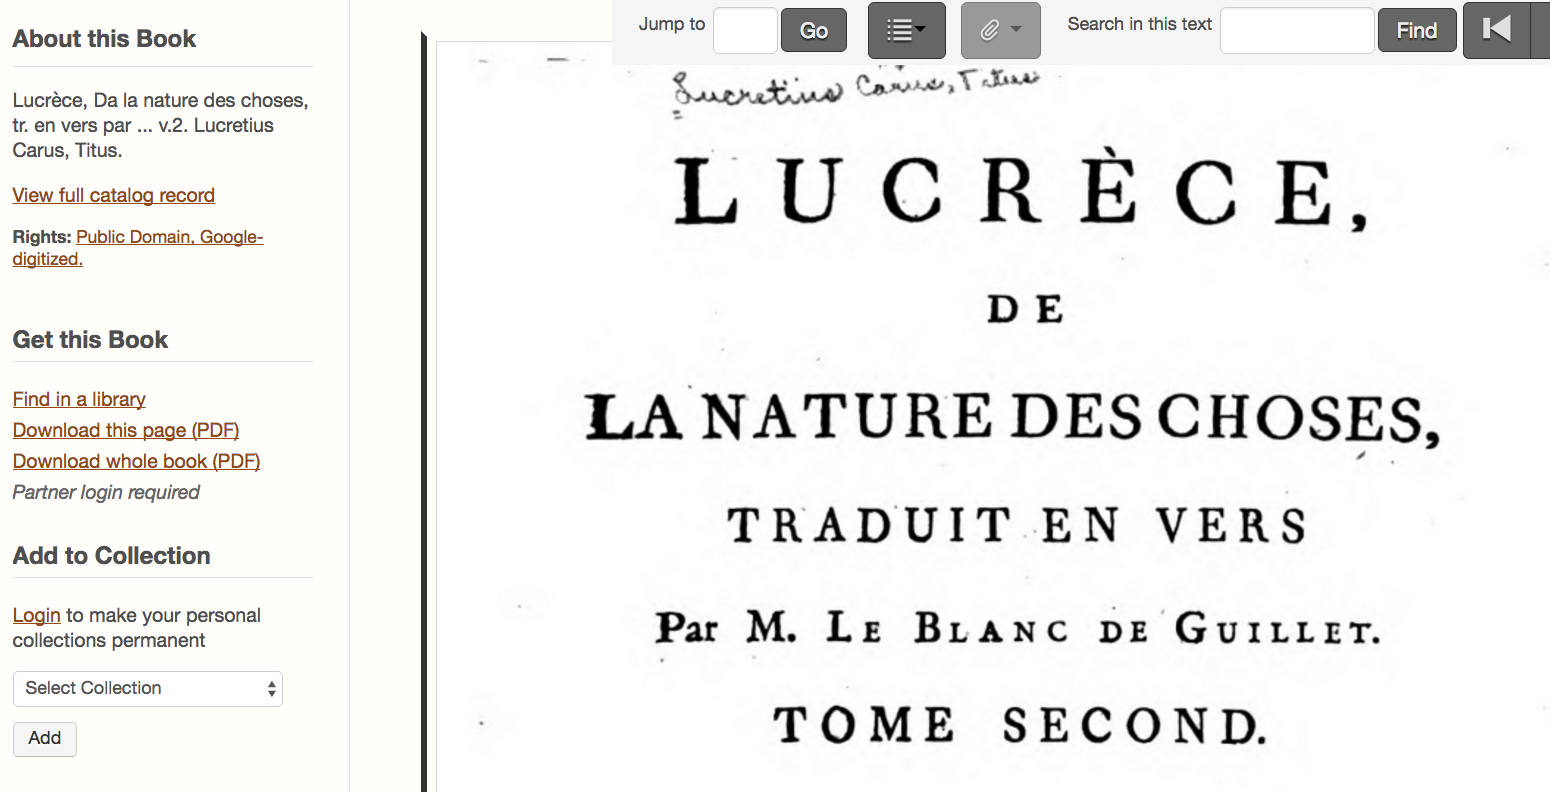
Classification of Lucretius.
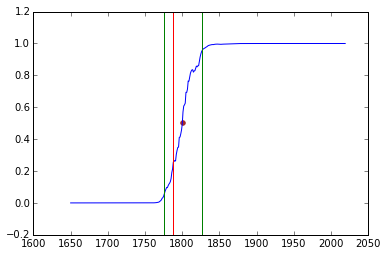
Blue line is classifier probability for each year Red vertical line is actual date. Outer bands are 90% confidence.
Next steps
- Subject Headings (much denser)
- Individual research collections (in or out)
- Geographical subject areas
- OCR error
- Full-vocabulary models, not projected.
- SRP with bigrams and trigrams.