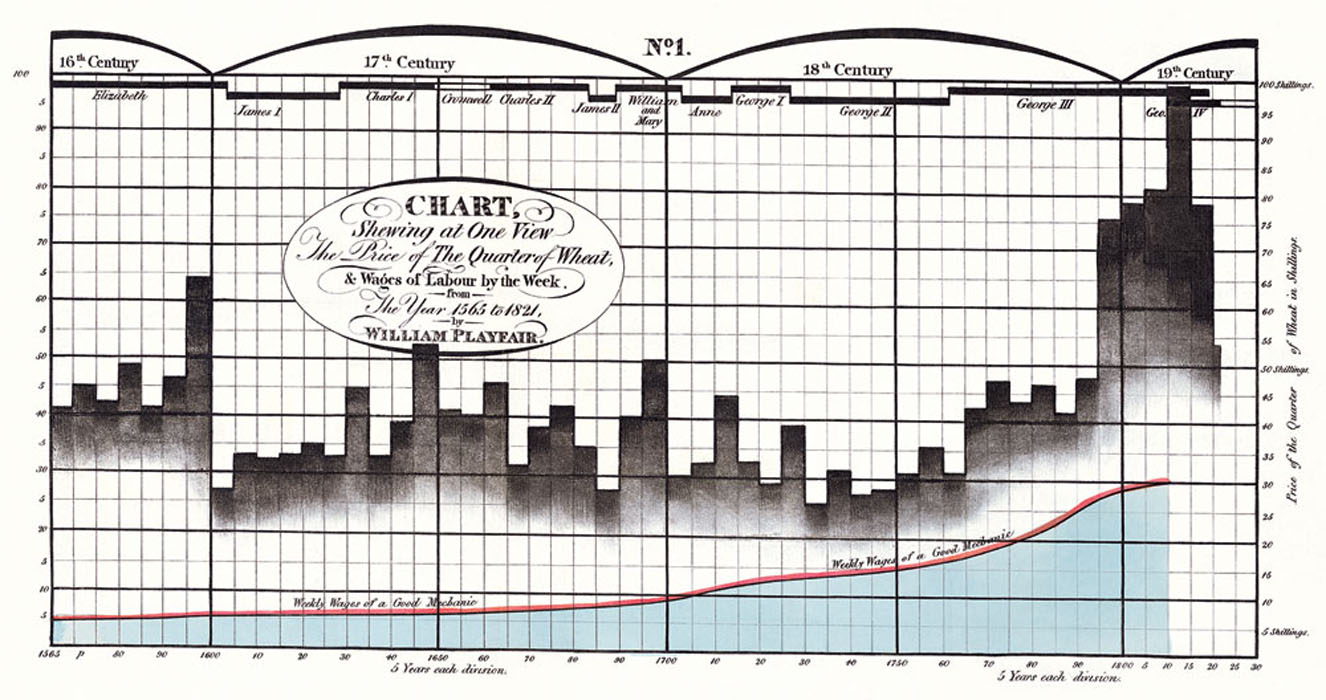
This Chart is different from the others in principle, as it does not comprehend any portion of time, and it is much inferior in utility to those that do; for though it gives the extent of the different branches of trade, it does not compare the same branch of commerce with itself at different periods. . .”
(Playfair, 1786, p. 101, from Tufte, 1983, p. 33).
Playfair tries to explain the bar chart:
Suppose the money received by a man in trade were all in guineas,and that every evening he made a single pile of all the guineas received during that day, each pile would represent a day, and its height would be proportional to the receipts of that day; so that by this plain operation,time, proportion, and amount, would all be physically combined. Lineal arithmetic, then, it may be averred,is nothing more than those piles of guineas represented on paper.


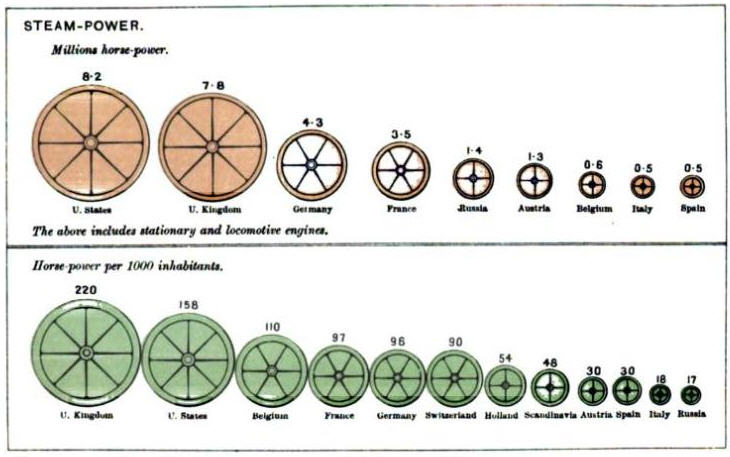
 Caption: Playfair's Pie and Circle Charts, 1801